If you haven’t already, check out Arun Ulag’s hero blog “FabCon and SQLCon 2026: Unifying databases and Fabric on a single, complete platform” for a complete look at all of our FabCon and SQLCon announcements across both Fabric and our database offerings.
From “What’s Wrong?” to Evidence Based Decisions
Modern analytics workloads demand more than fast queries — they demand observability.
When a query slows down or a dashboard stalls, guessing gets expensive quickly.
Microsoft Fabric Data Warehouse (DW) provides a set of built‑in monitoring tools that help customers observe, understand, and act with confidence when performance issues arise.
This article walks through how customers use current first‑party tools in Fabric DW—without custom scripts or external systems—to answer real production questions such as:
- Why is my query slow right now?
- Which SQL query is slowing a Power BI report?
- Who is consuming the most capacity?
- What caused a performance incident?
- How do I identify and explain capacity throttling?
Monitoring tools overview
Real-time troubleshooting with Dynamic Management Views (DMVs)
DMVs provide live information about executing queries, sessions, and connections. They are best used when something is happening right now.
Commonly used views:
- sys.dm_exec_requests
- sys.dm_exec_sessions
- sys.dm_exec_connections
Learn more: Monitor Microsoft Fabric Data Warehouse using DMVs
Historical analysis and pattern detection using Query Insights (QI)
Query Insights captures completed queries over time and provides aggregate insights for:
- Long-running query patterns
- Frequently executed queries
- Historical performance comparison
- Query attribution by user
Key views include:
- queryinsights.exec_requests_history
- queryinsights.long_running_queries
- queryinsights.frequently_run_queries
- queryinsights.sql_pool_insights
Learn more: Query Insights in Microsoft Fabric Data Warehouse
Capacity health and throttling visibility with Capacity Metrics App
The Capacity Metrics App exposes Fabric capacity utilization, saturation, throttling events, and system behavior. This is the fastest way to determine whether slow performance is caused by capacity pressure rather than query logic.
Learn more about the Capacity Metrics app:
- Capacity Metrics app overview
- Capacity Metrics app: Compute page
- Capacity Metrics app: Timepoint summary page
Code free experience with Monitoring UX
The Monitoring UX (Query Activity tab) provides a UI-based way to:
- View running and completed queries
- Filter by user, status, or time
- Cancel long-running queries (with permissions)
Learn more: Use Query Activity (Monitoring UX) in Microsoft Fabric Data Warehouse
User scenario: tracing a capacity spike back to the exact query
Notice capacity usage spikes
Monitoring typically starts at the capacity level. In the Fabric Capacity Metrics app, the CU % over time chart highlights periods of elevated or sustained compute usage. These spikes indicate when the capacity was under pressure, but not yet why.
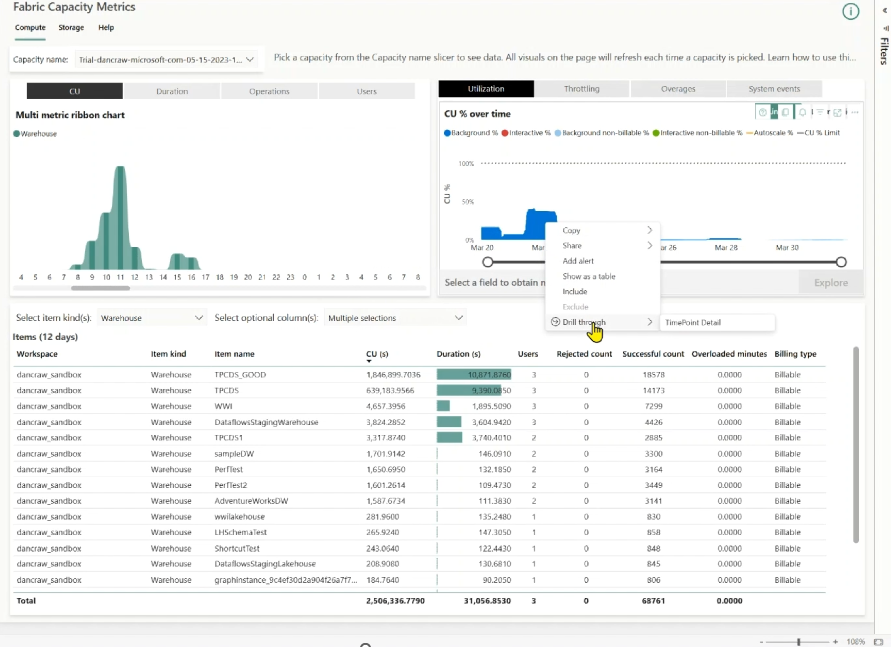
Figure: Fabric Capacity Metrics app – CU % overtime chart.
Identify the operations driving the spike
Once a spike is identified, narrow the scope by reviewing operations during the affected time window.
In the Background operations for time range table, filter to Warehouse operations and sort by Total CU (s). This surfaces the specific operations that consumed the most compute during the spike, reducing the investigation from a broad capacity symptom to a small set of high-impact operations.
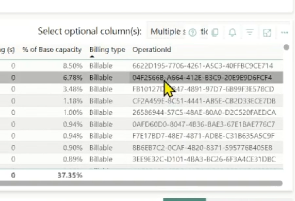
Figure: Get the OperationId in the drill through experience.
Drill down to find the distributed statement ID using the most CUs
Each expensive operation surfaced in the Capacity Metrics app has an Operation ID. For Data Warehouse workloads, this Operation ID is the distributed statement ID—a stable identifier that uniquely represents the distributed execution of a SQL statement. This ID is the critical bridge between capacity‑level telemetry and query‑level diagnostics.
Find the query details in Query Insights (QI)
Use the distributed statement ID as the pivot into Query Insights (QI).
Querying queryinsights.exec_requests_history with this ID reveals the full query context: the SQL text, execution duration, start and end times, and historical behavior. This final step connects a capacity-level spike directly to the exact query execution that caused it, turning a vague usage anomaly into a concrete, actionable root cause.
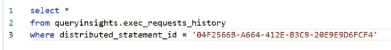
Figure: Correlate operation id from Capacity Metrics App with details QI.
User Scenario: Identify a long running query and compare performance over time
Identify long‑running queries (live)
Use sys.dm_exec_requests to identify currently running queries that are consuming excessive time or CPU. This view exposes only active requests.
— Find currently running queries ordered by elapsed time
SELECT
r.session_id,
r.start_time,
r.status,
r.total_elapsed_time AS elapsed_time_ms,
s.login_name,
s.program_name,
r.query_hash
FROM sys.dm_exec_requests AS r
JOIN sys.dm_exec_sessions AS s
ON r.session_id = s.session_id
WHERE r.status = ‘running’
ORDER BY r.total_elapsed_time DESC;
Use this when:
- Users report slowdowns right now.
- You need to identify blocking or runaway executions.
DMVs show live state only. Once the query completes, its execution details are no longer available through DMVs.
Check pool health before tuning the query (SQL Pool Insights)
Before assuming the query itself is the problem, determine whether the SQL pool was under pressure when the slowdown occurred.
SQL Pool Insights provides pool‑level context that explains why many queries may be slow at the same time.
— Show periods when the SELECT pool was under pressure in the last 24 hours
SELECT sql_pool_name, timestamp, is_pool_under_pressure
FROM queryinsights.sql_pool_insights
WHERE sql_pool_name = ‘SELECT’
AND timestamp >= DATEADD(hour, -24, GETDATE())
AND is_pool_under_pressure = 1
ORDER BY timestamp DESC;
Pivot to historical analysis with Query Insights
As the query executes, use Query Insights to analyze historical behavior. The queryinsights.exec_requests_history view stores execution data for completed queries, including CPU time and data scanned.
Each execution includes a query_hash, which represents the logical shape of the query. This allows you to compare multiple executions of the same query even when literal values differ.
— Compare historical executions of the same query
SELECT
start_time,
total_elapsed_time_ms,
allocated_cpu_time_ms,
data_scanned_disk_mb,
data_scanned_memory_mb,
data_scanned_remote_storage_mb,
row_count
FROM queryinsights.exec_requests_history
WHERE query_hash = ‘<query_hash_from_previous_step>’
ORDER BY start_time DESC;
This comparison helps you rationalize performance changes, for example:
- Higher data scanned → data growth, missing filters, or plan changes
- Higher CPU with similar data scanned → inefficient operators or joins
- Higher elapsed time without higher CPU → contention or capacity pressure
Why this matters
By combining:
- DMVs for live detection
- Query Insights + query_hash for historical comparison
You can determine whether a query is:
- A one‑off expensive execution.
- Regressing over time.
- Impacted by data growth or workload contention.
This turns vague symptoms like “capacity spiked” or “the query is slower” into a precise, explainable performance narrative backed by first‑party telemetry.
User scenario: Evaluate Pool Pressure Before Tuning Queries (SQL Pool Insights)
When users notice that queries are slow or taking a long time to run, the default reaction is usually to focus on tuning the SQL itself. However, query slowness may stem from environmental factors, such as SQL pool pressure caused by high concurrency or resource-intensive queries, rather than an inherent issue with the query being examined.
SQL Pool Insights provides pool‑level context that answers a critical question early:
Are queries slow because the pool is under pressure – or because this specific query regressed?
Check if the SQL pool was under pressure
Use SQL Pool Insights to determine whether the SELECT or NON-SELECT pool was under sustained pressure during the slowdown window.
— Identify periods when the SELECT pool was under pressure
SELECT
sql_pool_name,
timestamp,
is_pool_under_pressure,
max_resource_percentage,
current_workspace_capacity
FROM queryinsights.sql_pool_insights
WHERE sql_pool_name = ‘SELECT’
AND timestamp >= DATEADD(hour, -24, GETDATE())
AND is_pool_under_pressure = 1
ORDER BY timestamp DESC;
This view records event-based telemetry whenever:
- Pool pressure persists for ≥ 1 minute.
- Pool configuration changes.
- Workspace capacity SKU changes.
If pressure events align with query slowdowns, the issue is environmental, not query logic.
Distinguish concurrency pressure vs. bad actor queries
SQL Pool Insights helps separate two very different scenarios:
- High concurrency pressure → many queries competing
- Bad actor pressure → Queries monopolizing resources
Correlate pool pressure with query executions
Once pressure is confirmed, correlate pressure windows with actual queries to find the bad actor.
— Correlate pool pressure events with executed queries
WITH PoolPressure AS (
SELECT DISTINCT timestamp
FROM queryinsights.sql_pool_insights
WHERE is_pool_under_pressure = 1
)
SELECT
erh.distributed_statement_id,
erh.query_hash,
erh.command,
erh.start_time,
erh.end_time,
erh.total_elapsed_time_ms,
erh.allocated_cpu_time_ms,
erh.data_scanned_disk_mb,
erh.data_scanned_memory_mb,
erh.data_scanned_remote_storage_mb
FROM queryinsights.exec_requests_history AS erh
JOIN PoolPressure p
ON p.timestamp BETWEEN erh.start_time AND erh.end_time
ORDER BY erh.total_elapsed_time_ms DESC;
This step identifies which query executions overlapped with pool pressure, allowing you to move confidently from “pool is stressed” to “this query caused it.”
Why this step matters in the slow‑query journey
Without SQL Pool Insights:
- Users tune queries unnecessarily.
- Root cause (capacity, configuration, bad actor) remains hidden.
With SQL Pool Insights:
- Users validate pool health first.
- Avoid tuning when the real fix is capacity, workload isolation, or scheduling.
- Confidently identify the query that caused pressure, not just the query that suffered.
Closing
Use this end-to-end flow to move from symptom to root cause: detect (DMVs/Query Activity), validate (SQL Pool Insights), correlate (Capacity Metrics → Query Insights), and compare (Query Insights + query_hash).
- Detect slowness: Use DMVs or Query Activity to find slow or running queries.
- Evaluate pool health: Use SQL Pool Insights to confirm whether the pool is under pressure and why.
- Trace impact: Use Capacity Metrics to map the spike to the distributed statement ID in Query Insights.
- Explain regression: Use Query Insights and query_hash to compare current vs. historical executions.
We’d love to hear your feedback or questions—join the conversation in the comment section.
Related blog posts
Mastering monitoring in Microsoft Fabric Data Warehouse
Live connectivity in Migration Assistant for Fabric Data Warehouse (Preview)
The live connectivity in Migration Assistant for Fabric Data Warehouse lets you connect directly to your source system and migrate object metadata into a new Fabric warehouse. This preview is designed to help you accelerate the migration and reduce upfront prep by eliminating the need to generate and upload a DACPAC for the metadata step.
dbt+ Microsoft Fabric: A strategic investment in the modern analytics stack
Modern analytics teams are adopting open, SQL-first data transformation, robust CI/CD and governance, and seamless integration across lakehouse and warehouse platforms. dbt is now the standard for analytics engineering, while Microsoft Fabric unifies data engineering, science, warehousing, and BI in OneLake.
Microsoft Fabric
Accelerate your data potential with a unified analytics solution that connects it all. Microsoft Fabric enables you to manage your data in one place with a suite of analytics experiences that seamlessly work together, all hosted on a lake-centric SaaS solution for simplicity and to maintain a single source of truth.
Get the latest news from Microsoft Fabric Blog
This will prompt you to login with your Microsoft account to subscribe
Visit our product blogs
View articles by category
- Activator
- AI
- Announcements
- Apache Iceberg
- Apache Spark
- Community
- Community Challenge
- Data Engineering
- Data Factory
- Data Lake
- Data loss prevention
- Data Science
- Data Warehouse
- Databases
- Developer
- Fabric IQ
- Fabric ML
- Fabric platform
- Fabric Public APIs
- Fabric Workload
- Information protection
- Lakehouse
- Machine Learning
- Microsoft Fabric
- Monthly Update
- OneLake
- Power BI
- Power BI reports
- Real-Time Intelligence
- Roadmap
- Security and Compliance
- semantic model
- Uncategorized
View articles by date
- March 2026
- February 2026
- January 2026
- December 2025
- November 2025
- October 2025
- September 2025
- August 2025
- July 2025
- June 2025
- May 2025
- April 2025
- March 2025
- February 2025
- January 2025
- December 2024
- November 2024
- October 2024
- September 2024
- August 2024
- July 2024
- June 2024
- May 2024
- April 2024
- March 2024
- February 2024
- January 2024
- December 2023
- November 2023
- October 2023
- September 2023
- August 2023
- July 2023
- June 2023
- May 2023
- April 2023
- March 2023
- February 2023
- January 2023
- December 2022
- November 2022
- October 2022
- September 2022
- August 2022
- July 2022
- June 2022
- May 2022
- April 2022
What's new
- Microsoft 365
- Games
- Surface Pro 9
- Surface Laptop 5
- Surface Laptop Studio
- Surface Laptop Go 2
- Windows 11 apps
Microsoft Store
Education
- Microsoft in education
- Devices for education
- Microsoft Teams for Education
- Microsoft 365 Education
- Office Education
- Educator training and development
- Deals for students and parents
- Azure for students
Business
- Microsoft Cloud
- Microsoft Security
- Azure
- Dynamics 365
- Microsoft 365
- Microsoft Advertising
- Microsoft Industry
- Microsoft Teams
Developer & IT
- Developer Centre
- Documentation
- Microsoft Learn
- Microsoft Tech Community
- Azure Marketplace
- AppSource
- Microsoft Power Platform
- Visual Studio
Company
- © 2026 Microsoft