As we kick off FabCon, this update captures the momentum we’re seeing across the Fabric platform and the conversations happening with customers and partners right now. March brings a wide range of enhancements across governance, data engineering, real-time intelligence, data science, extensibility, and AI—all designed to help teams build, operate, and scale end‑to‑end data solutions with confidence.
Many of the capabilities highlighted here reflect direct feedback from the community and real‑world usage we’ve learned from—including insights shared leading up to (and during) FabCon. We are eager to share what’s new and to continue the conversation throughout the week.
If you haven’t already, check out Arun Ulag’s hero blog “FabCon and SQLCon 2026: Unifying databases and Fabric on a single, complete platform” for a complete look at all of our FabCon and SQLCon announcements across both Fabric and our database offerings.
-
- Events and Announcements
- Don’t miss the next Monthly Data Days Sessions
- Couldn’t make it to Atlanta or just want more FabCon + SQLCon? Join us in Barcelona this September
- OneLake Catalog Govern for admins (Generally Available
- OneLake Catalog search API and MCP tool (Preview)
- Workspace tags (Generally Available)
- Data loss prevention policies for Fabric—Extending restrict access to structured data in OneLake (Preview)
- Lakehouse Signals in IRM (Generally Available)
- Quick policy for data theft for Fabric (Generally Available)
- Insider Risk Management PAYG Usage Report (Generally Available)
- Purview DSPM for AI for Fabric Copilots and data agents (Preview)
- Branched workspace with Git integration (Preview)
- Selective branching with Git integration (Preview)
- Compare code changes with Git integration (Preview)
- Connection reference item type in Variable Library (Preview)
- Bulk import and export items definition APIs (Preview)
- Fabric CLI v1.5—Power BI Scenarios, CI/CD Deployments, and DX Improvements
- CI/CD deployments from the CLI—deploy workspaces in One Command
- Fabric CLI as an Execution Layer for AI Agents
- Fabric Remote MCP Server: AI agents operate directly in your Fabric environment
- Fabric MCP AI code assistants (Generally Available)
- Extensibility (Generally Available)
- CI/CD & remote support (Preview)
- What’s new in workload management
- Admin portal: centralized admin workload overview (Generally Available)
- Self-service workload publishing (Generally Available)
- Fabric Runtime 2.0 (Preview)
- Custom Live Pools for Fabric Data Engineering
- Job concurrency and queue monitoring experience for Fabric Data Engineering
- Resource Profiles for Fabric Data Engineering
- Installing libraries with Quick mode in Spark Environment (Preview)
- Dynamic session sharing limit up to 50 for high concurrency
- Data export settings for notebooks
- Session starts insights into Fabric Data Engineering
- Z-order and liquid clustering support in the Native Execution Engine
- Copilot for data engineering and data science
- Fabric notebook custom agent inside VS Code
- Tenant switching inside Fabric Data Engineering VS Code extension
- Enable new kernels inside Fabric Data Engineering VS Code extension
- Support for multiple schedules in Fabric materialized lake views
- PySpark support for Fabric materialized lake views (Preview)
- Move data from source to Lakehouse in a few moves using Copy job
- Notebook supports Lakehouses auto-binding in Git
- Notebook Resources Folder Support in Git
- Fabric notebook public APIs (Generally Available)
- Improved Copilot completion for Fabric notebooks
- Create files in the notebook resources folder
- Fabric data agents (Generally Available)
- Advanced security and governance in data agents (Preview)
- Data source enhancements for data agents (Preview)
- Insider Risk Management PAYG Usage Report (Generally Available)
- AutoML in Fabric (Generally Available)
- Fabric Data Warehouse recovery (Preview)
- Alerts and actions
- Analyze unstructured text using T-SQL AI functions (Preview)
- ANY_VALUE aggregate
- Fabric warehouse custom SQL pools (Preview)
- SQL Audit Logs (Generally Available)
- COPY INTO and OPENROWSET support for OneLake sources (Generally Available)
- Outbound Access Protection (OAP) support for Warehouse (Generally Available)
- Full query text available in Query Insights
- Live connectivity in Migration Assistant for Fabric Data Warehouse (Preview)
- Simplify data access with data sources (Generally Available)
- Business Events in Microsoft Fabric (Preview)
- Building event-driven, real-time applications on database changes with Fabric Eventstreams Deltaflow (Preview)
- Real-time stream processing with Fabric Eventstreams and Spark notebooks (Preview)
- Anomaly Detector full-item experience
- Operations agent playbook improvements and messages
- Live update for Real-Time Dashboards
- Eventstream SQL Operator (Generally Available)
- Anomaly Detection as a source in Eventstream
- Data series colors for real-time dashboard visuals
- Use Copilot to create visuals in real-time dashboards (Preview)
- Instantly run and preview functions in Microsoft Fabric Eventhouse: no code required (Preview)
- Workspace monitoring dashboard templates in Microsoft Fabric Eventhouse (Preview)
-
- Richer Change Data Capture (CDC) with Oracle, Fabric DW, and SCD Type 2
- Every row is traceable with built-in audit columns
- Workspace Monitoring for Faster, Scalable Troubleshooting
- Boost performance automatically with AutoPartitioning
- Preview-only steps (Generally Available)
- Fabric Variable Library integration (Generally Available)
- New data destinations
- Schema support in Fabric data destinations (Generally Available)
- AI-Powered Prompt Transform (Generally Available)
- Publish experience UX + performance improvements (parallelized query validations)
- Save As Improvements: Scheduled Refresh Policies and Public APIs
- SharePoint site picker in Modern Get Data and Data destinations (Preview)
- Diagnostics download (Preview)
- Advanced Edit for destinations (Preview)
- Data destination validations during publish (Preview)
- Evaluate query API (Preview)
- Data Factory MCP (Preview)
- IBM Netezza ODBC Driver (Generally Available)
- Google BigQuery connector (Generally Available)
- QuickBooks Online connector retirement
- Lakehouse Maintenance activity in Fabric Pipelines (Preview)
- Refresh SQL endpoint activity in Fabric pipelines (Preview)
- Generate Pipeline expressions with Copilot (Generally Available)
- Workspace monitoring for Fabric Data Factory’s pipelines and Copy job (Preview)
- Interval-based schedules
- New Airflow APIs
- New Airflow Operators
- PowerShell model for gateways (Generally Available)
- Certificate and proxy support for VNet data gateway (Generally Available)
- Virtual network data gateway supports up to nine instances
- SSIS Pipeline Activity (Preview)
- Seamlessly upgrade Azure Data Factory and Synapse pipelines to Microsoft Fabric (Preview)
- Mirroring for SAP (Generally Available)
- Mirroring for Oracle databases (Generally Available)
- Mirroring for Azure Database for MySQL (Preview)
- Mirroring for SharePoint List (Preview)
- Extended Capabilities in Mirroring: Change Delta Feed and Snowflake Mirroring Support for Views (Preview)
- Mirrored database now supports up to 1000 tables
Events and Announcements
Don’t miss the next Monthly Data Days Sessions
On March 26 we have a special edition of Fabric Data Days featuring two topics. Join us at 8 AM Pacific for a session on getting started with Fabric IQ. Then at 3 PM Pacific we’ll discuss mapping and spatial analytics in Fabric.
Couldn’t make it to Atlanta or just want more FabCon + SQLCon? Join us in Barcelona this September.
FabCon Europe is happening again in 2026. Mark your calendars for September 28 – October 1, 2026.
Register now to access Super Early Bird pricing!
Fabric Platform
OneLake Catalog Govern for admins (Generally Available)
In today’s data-driven world, effective data governance is crucial to ensure the integrity, security, and usability of data. OneLake catalog is available for Fabric admins, providing tools and insights to govern and secure data estates within Fabric in one place.
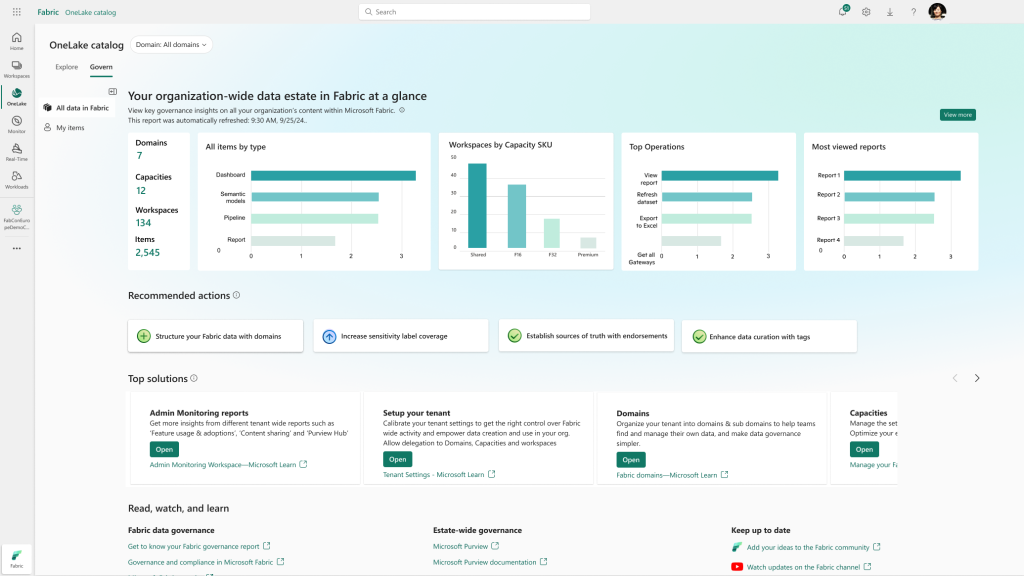
Figure: OneLake Catalog: Govern for Admin view
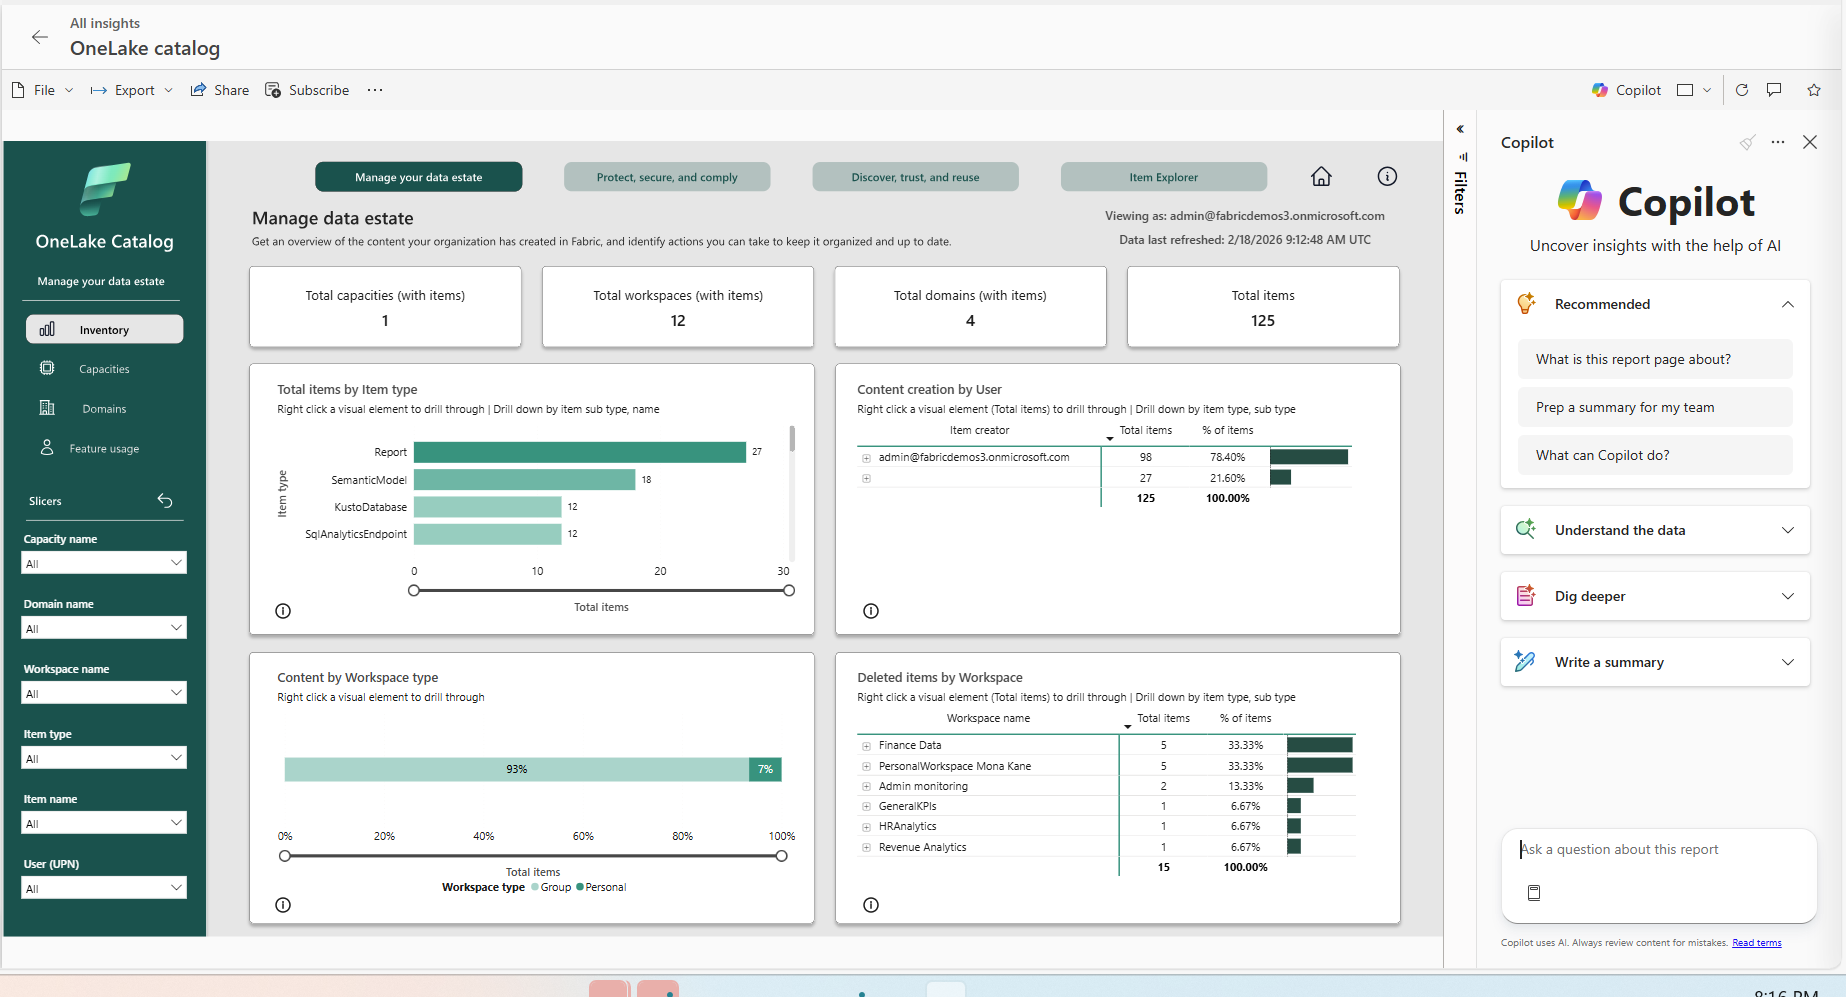
Figure: OneLake Catalog: Govern for admin—view more report.
OneLake Catalog search API and MCP tool (Preview)
OneLake Catalog’s Search API brings cross-workspace discovery to code. Instead of traversing workspace-by-workspace and “listing everything,” a single search request can locate matching items across your accessible estate based on catalog metadata and the user’s permissions.
Search is designed to help even when the exact name isn’t known. Free-text matching includes the item’s display name and description, so a keyword you remember is often enough to find the right entry. Results can be filtered by the item’s type to narrow down the scope of your search. The set of supported metadata signals and filters is expected to grow, enabling richer and more targeted discovery scenarios.
The catalog search capability is also included as a built-in tool in the Fabric Core MCP server so AI agents can reliably locate the right Fabric asset as part of a broader workflow, then continue with follow‑up actions using other tools.
Workspace tags (Generally Available)
Fabric tags add meaningful metadata so people can find the right content faster and organize it consistently. That capability is available for workspaces. Workspace tags add shared context (like team, project, or cost center) at the workspace level, helping teams discover and manage workspaces more efficiently, while also enabling scalable governance through APIs.
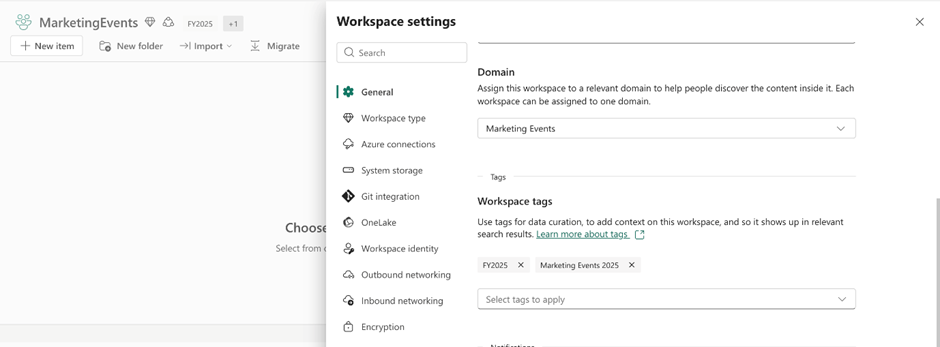
Figure: Workspace settings screen showing applied workspace tags
Workspace tags are built on the existing Fabric tags model: tags are defined once, then applied on items and workspaces. Workspace admins can apply and remove tags in workspace settings, making it easy to add shared context at the workspace level. A workspace can have up to 10 tags applied.
Workspace tags are surfaced in key discovery experiences so they’re usable in day-to-day navigation: Workspaces can be filtered by tags both in the workspaces list and in OneLake Catalog Explorer, a tags indicator also appears in the workspaces list and in OneLake Catalog Explorer next to every tagged workspace. Tag names are shown on the workspace screen itself, making the workspace context immediately visible.
Tagging can be retrieved and managed at scale using APIs, enabling consistent application and reporting across workspaces.
Data loss prevention policies for Fabric—Extending restrict access to structured data in OneLake (Preview)
When handling sensitive data, it might be challenging to find the right balance between federating data and keeping it secure and compliant. Data Loss Prevention (DLP) policies enable organizations to detect sensitive data and surface it to users and admins when it is found. The Restrict Access action allows you to restrict access to your data once the sensitive information is detected.
DLP Restrict Access reduces the risk of exposure to unauthorized users, without slowing analytics or collaboration. Customers can scale Fabric with confidence, meeting compliance requirements while enabling secure, enterprise-wide data sharing.
With this release, you’ll be able to apply access restrictions through DLP on:
- Warehouses
- KQL databases
- SQL databases
- Lakehouses (previously supported)
- Semantic models (previously supported)
- Cosmos DB and mirrored databases are coming soon.
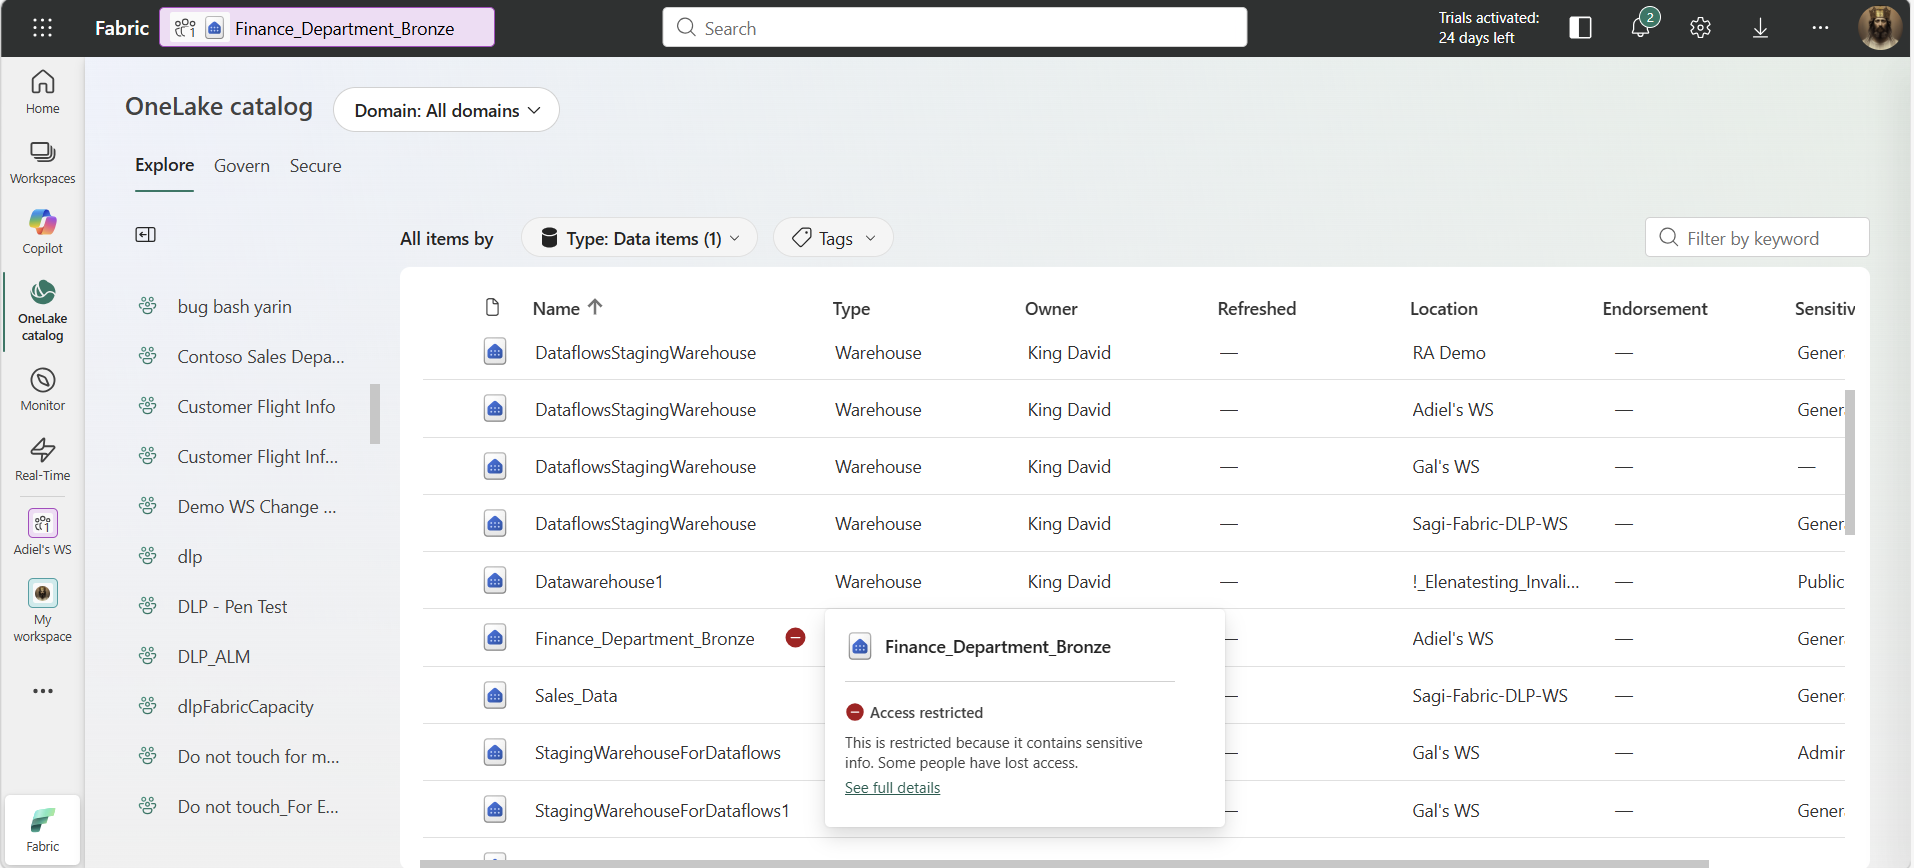
Figure: Fabric warehouse with a restrict access indication
Admins can ensure that sensitive data is protected consistently wherever it lives and however it is accessed.
Learn more about restrict access in DLP.
Lakehouse Signals in IRM (Generally Available)
Microsoft Purview Insider Risk Management cross-references millions of signals across all your products, to create comprehensive profiles of potentially unethical behavior inside your organization.
Using Lakehouse indicators in Insider Risk Management enables security teams to detect and investigate risky data activity in OneLake with greater precision and context. By incorporating Fabric Lakehouse signals directly into insider risk policies, security teams can correlate data access and movement with DLP, labeling, and audit signals in a single investigation experience—reducing blind spots and accelerating response to potential data exfiltration or misuse. This provides stronger protection for high‑value analytics data while maintaining built‑in privacy controls and avoiding the operational overhead of deploying separate monitoring tools.
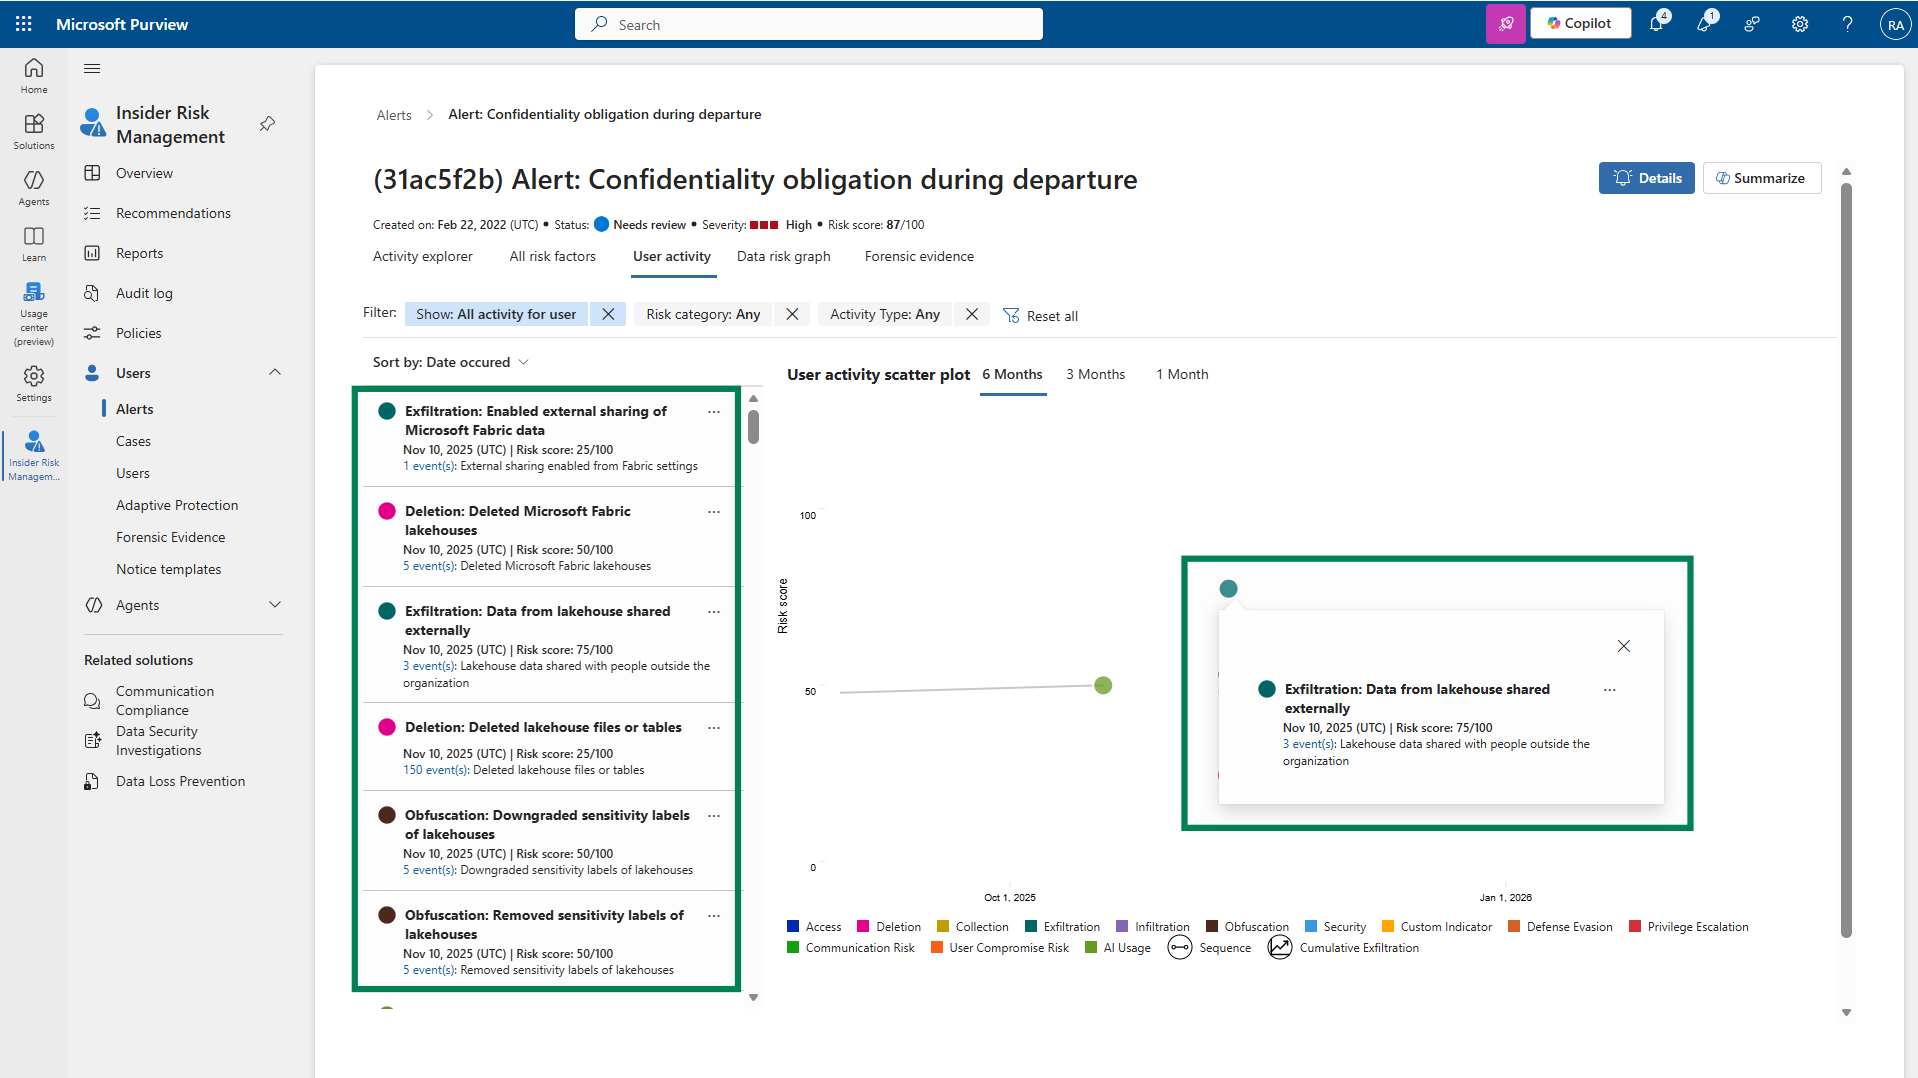
Figure: Lakehouse indicators used within the IRM tool
Learn more about Fabric indicators in Insider Risk Management.
Quick policy for data theft for Fabric (Generally Available)
A new quick policy for the Data Theft rule is available for Fabric. This streamlined experience makes it easier to set up protection against data exfiltration scenarios, helping security teams take action faster when sensitive Fabric data is at risk.
Learn more about IRM quick policies.
Insider Risk Management PAYG Usage Report (Generally Available)
The Microsoft Purview Insider Risk Management pay-as-you-go feature usage report is designed to provide transparency to customers, enabling more accurate budget planning and policy tuning. IRM admins can check the distribution of PAYG processing units billed across workloads (Fabric), sub-workloads (Power BI, Lakehouse), and indicators (downloading Power BI reports, etc.) to fine-tune their policies and plan PAYG budgets accordingly.
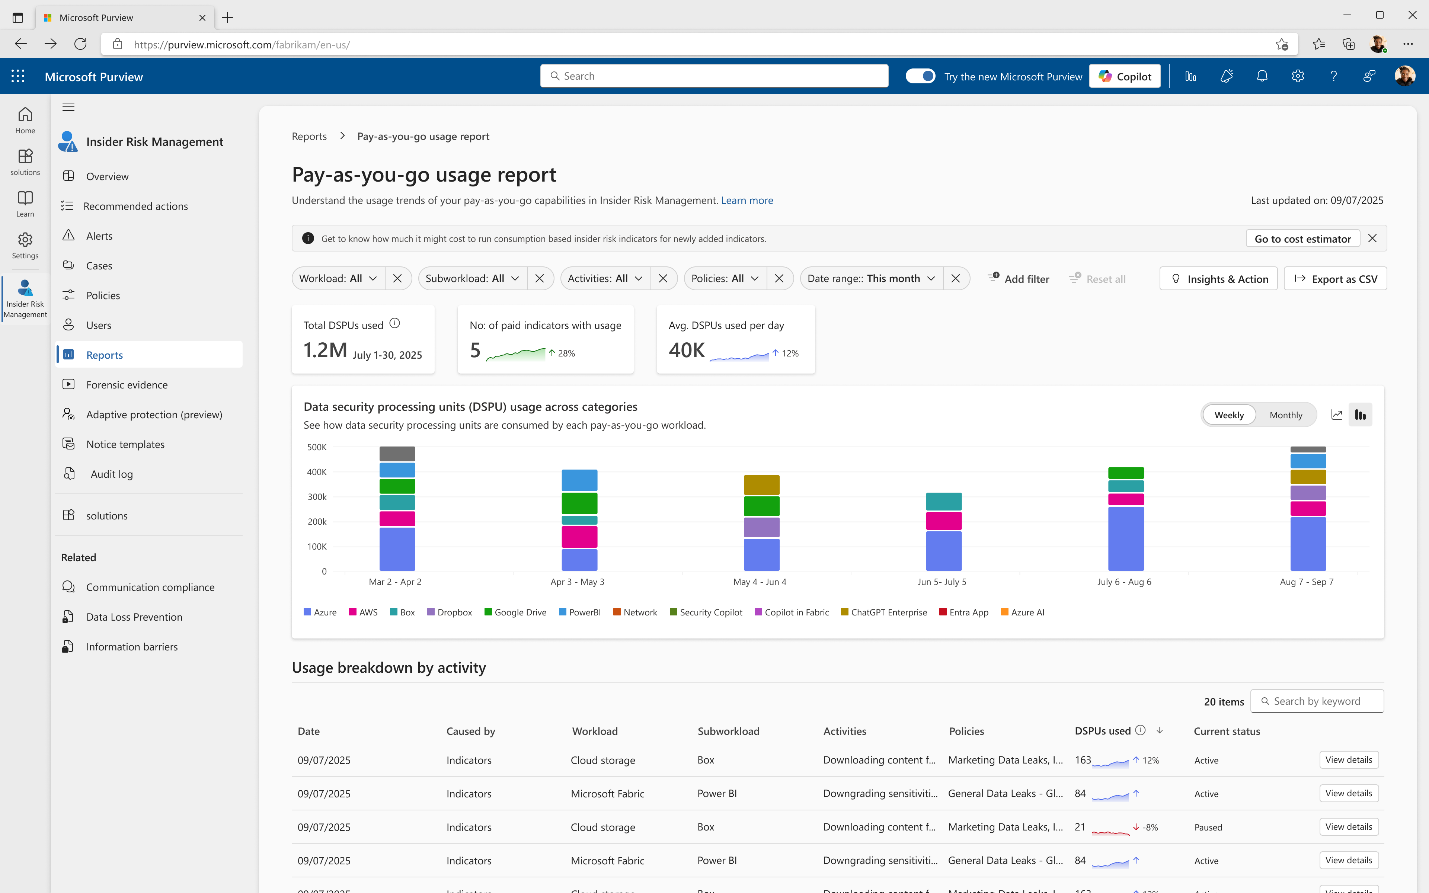
Figure: Pay-as-you-go Usage Report
Purview DSPM for AI for Fabric Copilots and data agents (Preview)
As AI adoption accelerates, organizations need built‑in protections to keep data safe. With Purview Data Security Posture Management (DSPM) for AI, customers gain visibility and control over AI interactions. DSPM for AI helps teams spot sensitive data risks in AI prompts and responses, identify risky AI behavior, and apply consistent governance using familiar tools like DSPM, Insider Risk Management, Audit, and eDiscovery—so organizations can move faster with AI, without compromising security or compliance.
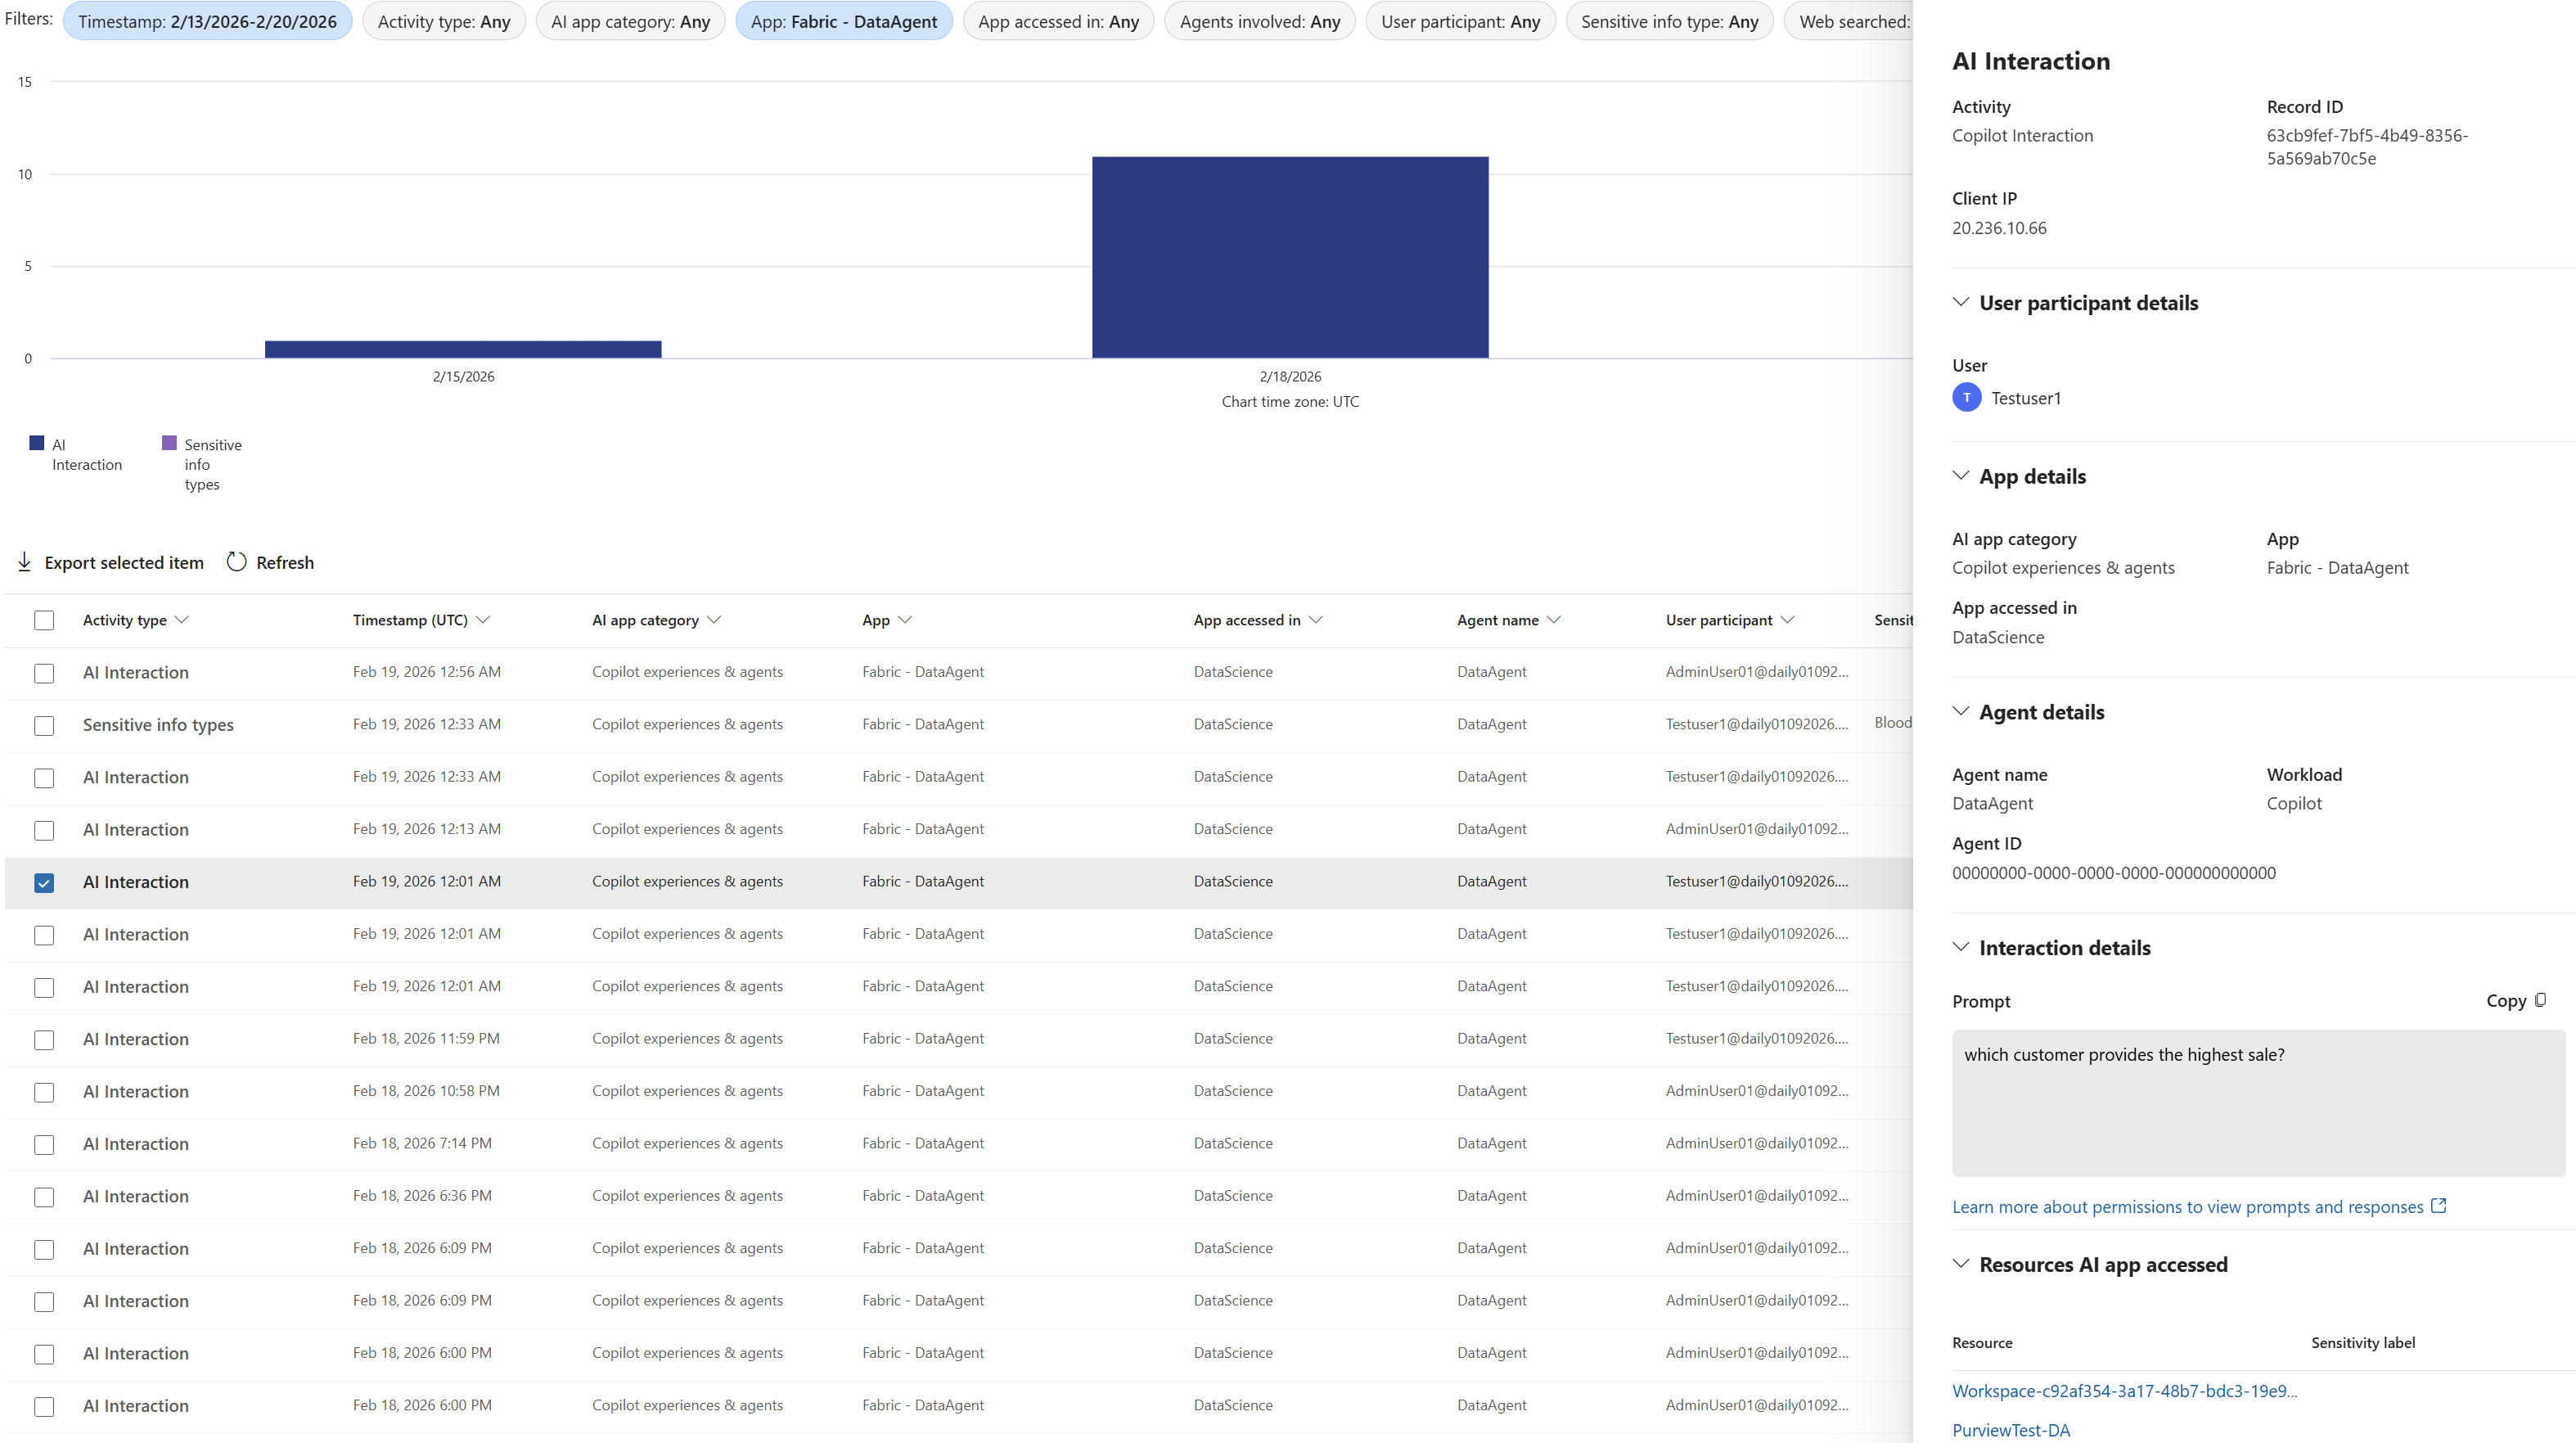
Figure: Purview DSPM for AI report showing Data Agent interaction in Fabric
Learn more about DSPM for Fabric Copilots.
Branched workspace with Git integration (Preview)
Branched workspace is a new developer experience designed to simplify how teams work with feature workspaces during a branch‑out flow. With clearer visual cues and richer context, developers can easily understand workspace relationships and work more confidently when branching and iterating on features. This feature will be released by the end of March 2026.
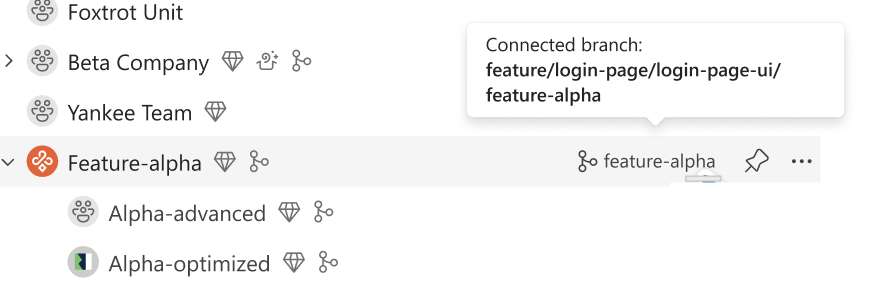
Figure: Fabric workspace tree showing the new relation between workspace and branched workspace
Follow our new Git developer experiences in Microsoft Fabric (Preview) announcement.
Selective branching with Git integration (Preview)
Fabric Git Integration Branch-out with selective branching introduces a more focused branch‑out experience in Fabric. Developers can select only the items they need for a feature, reducing clutter in the target workspace, improving reliability, and accelerating time‑to‑code. By working with a smaller, purpose‑built workspace, developers can iterate faster and with greater confidence.
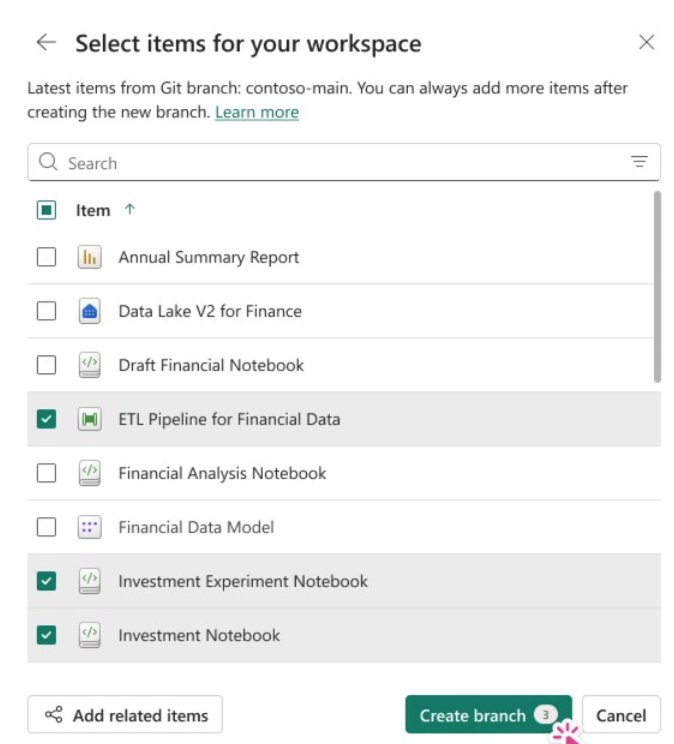
Figure: Branch-out selective branching dialog
Follow our new Git developer experiences in Microsoft Fabric (Preview) blog announcement.
Compare code changes with Git integration (Preview)
The new compare code changes experience helps developers confidently sync their Fabric workspace with a connected Git branch by clearly showing what changed before taking action. It provides a familiar code‑compare experience that highlights the exact differences since the last sync—down to the item and file level—whether the change originated in the workspace or in the repository. This makes it easier to review updates, understand their impact, and resolve conflicts by comparing workspace and Git versions side by side before committing, updating, or undoing changes.
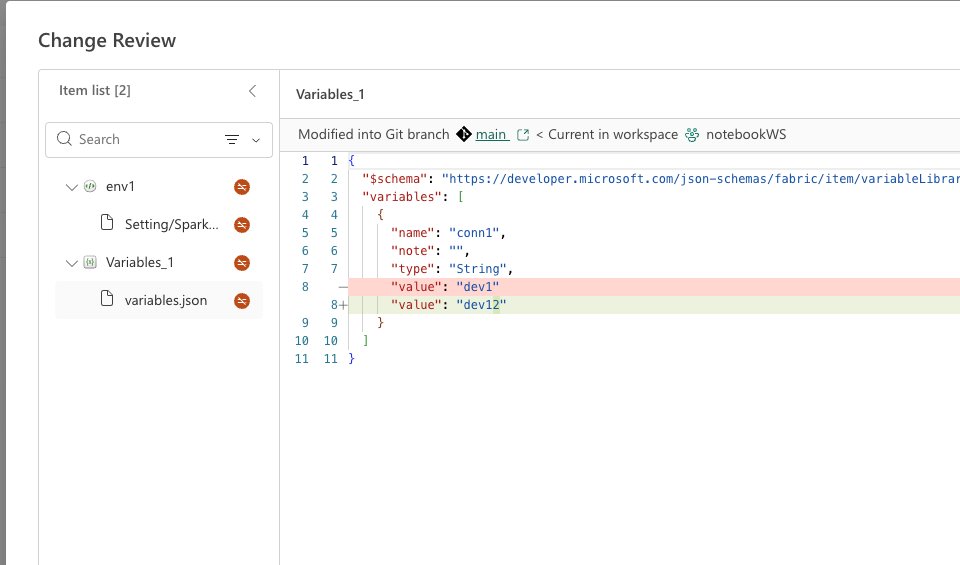
Figure: Git Integration code compares changes dialog
Follow our new Git developer experiences in Microsoft Fabric (Preview) blog announcement.
Connection reference item type in Variable Library (Preview)
The new connection reference item type in Variable Library introduces a new way to manage external data connections in Microsoft Fabric. This new variable type lets you reference existing connections—such as Azure SQL or Snowflake—by storing a connection ID in the Variable Library, instead of embedding static connection strings in code.
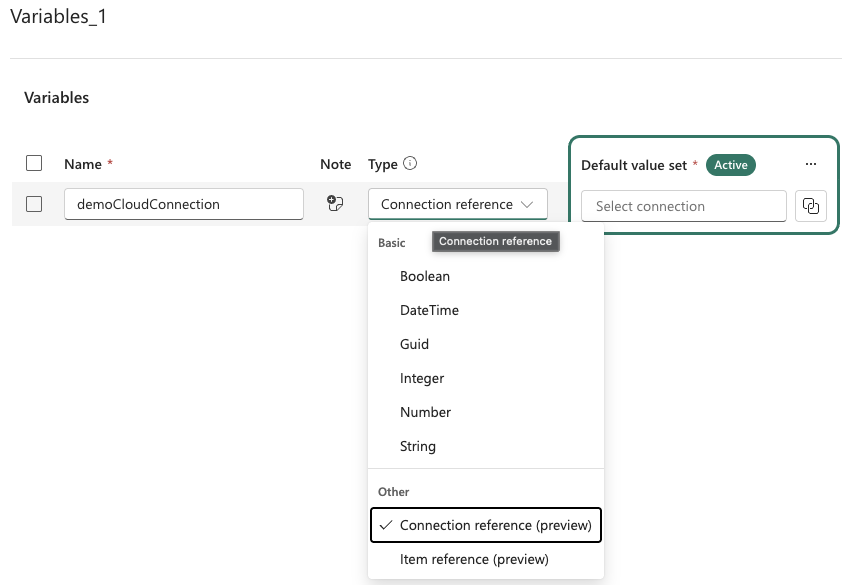
Figure: Variable Library “connection reference” item type option
Connection reference variables work seamlessly with CI/CD and Git, enable safer environment‑specific configuration across dev, test, and prod, and ensure only authorized connections can be selected through the UI. This makes it easier to build, deploy, and manage Fabric solutions with cleaner configuration, stronger governance, and improved portability across CI/CD stages.
Bulk import and export items definition APIs (Preview)
These APIs enable you to programmatically export, import, and synchronize Fabric item definitions across workspaces at scale—all through the Fabric REST API.
Every Fabric item—whether it’s a Notebook, Report, Semantic Model, Data Pipeline, or KQL Dashboard—has an underlying item definition: a portable schema containing the item’s full configuration and content (encoded in Base64). The Import & Export Batch APIs let you:
- Export item definitions individually or in bulk from any workspace
- Import (create) items from definitions into a target workspace
- Update existing item definitions in-place for continuous deployment
- List & paginate through all items in a workspace for batch operations
Key scenarios
- Workspace migration: Moving items across workspaces, tenants, or regions is one of the most common requests from Fabric customers. The batch APIs let you export all items from a source workspace into a portable JSON manifest, then import them into any target workspace. This is invaluable for replicating environments across different tenants and cloning a production workspace for testing purposes.
- CI/CD and DevOps integration: To support enterprise DevOps practices in Microsoft Fabric, organizations can integrate the new Bulk Export and Import APIs into their CI/CD pipelines. Fabric item definitions can be treated as code—exported and versioned in Git using Fabric Git Integration or the bulk-export API, validated through pull request workflows, and promoted through a well-defined release process. When deploying across workspaces, the bulk-import API enables consistent, automated promotion into test and production environments using the underlying Fabric dependency logic that creates new items in the correct order, retains the original relations, and updates existing ones in place.
- Metadata backup and recovery: Schedule periodic batch exports to capture the full state of your workspace as versioned JSON manifests. Store them in Azure Blob Storage, a Git repository, or any durable storage. If something goes wrong, re-import the manifest to restore your workspace to a known-good state.
Resources
- Full announcement: Bulk import/export items definition APIs
- API documentation: Fabric Items API Reference
- Comprehensive guide: Item Management Overview
- Item definition structure and formats: Item Definition Reference
- How to handle async operations with polling: Long-Running Operations Guide
- App registration and authentication setup: Microsoft Entra ID Documentation
- CI/CD tutorial using Bulk API: CI/CD tutorial using the Bulk Export and Import APIs
Fabric CLI v1.5—Power BI Scenarios, CI/CD Deployments, and DX Improvements
The Fabric CLI v1.5 is the most scenario-driven update yet. Power BI developers can now trigger semantic model refreshes, rebind reports, and script end-to-end deployment workflows—all from the terminal, without portal context-switching.
The release also adds a new deploy command for CI/CD, interactive REPL mode, JMESPath filtering, notebook export in multiple formats, Python 3.13 support, and expanded coverage for Fabric items. Many of these improvements are community-contributed, making the CLI a comprehensive open-source automation surface for Fabric.
CI/CD deployments from the CLI—deploy workspaces in One Command
A new deploy command integrates the Fabric CI/CD Python library directly into the Fabric CLI, enabling full workspace deployments—including item rebinding and configuration—from a single command. Teams can run deployments from their terminal, GitHub Actions, or Azure DevOps pipelines. Combined with Service Principal authentication and federated credentials for GitHub OIDC, this enables zero-touch, Git-based promotion workflows that fit modern DevOps practices—no custom scripts or additional tools required.
For usage examples, refer to the CI/CD examples and setup guide.
Fabric CLI as an Execution Layer for AI Agents
Fabric CLI is designed to work well with AI agents. A structured agent instructions file and a dedicated Fabric CLI Skill provide AI assistants like GitHub Copilot and Claude with the context they need to generate correct CLI commands from natural language. Improved error messages with actionable guidance help agents self-correct, and the interactive REPL mode enables persistent terminal sessions for multi-step agent workflows.
Using a CLI as the execution layer for AI agents is an emerging industry pattern—instead of agents calling raw REST APIs (which require extensive token-heavy context about endpoints, auth, and payloads), agents issue concise CLI commands that encapsulate that complexity, making AI-driven Fabric automation more practical and reliable.
Learn more with Fabric CLI agent docs and AI assets on GitHub.
Fabric Remote MCP Server: AI agents operate directly in your Fabric environment
Fabric Remote MCP is a cloud-hosted MCP server that allows AI agents to perform real operations in your Fabric environment—create workspaces, manage permissions, work with item definitions, and more. No local installation is required. Agents authenticate via Entra ID and operate within your existing RBAC boundaries, with every tool invocation recorded in audit logs.
The preview launches with capabilities spanning workspace management, item CRUD and definitions, and permission management. It works with any MCP-compatible client, including GitHub Copilot, Cursor, and Claude Desktop.
Learn more in this blog post: Introducing Fabric MCP (Preview).
Fabric MCP AI code assistants (Generally Available)
The Fabric Local MCP is an open-source MCP server that runs on your machine. This solution integrates AI coding assistants with the comprehensive Fabric API, offering OpenAPI specifications, best-practice guidelines, item definition schemas, and example payloads to enable agents to produce precise, production-ready code while minimizing errors.
OneLake tools enable live file operations including upload, download, table inspection, and item creation. This update introduces integrated authentication, automatic retry, production SLAs, and telemetry. Install via npx @microsoft/fabric-mcp in any MCP-compatible client—it works with VS Code, Claude Desktop, Cursor, and more. Fabric Local MCP on GitHub.Fabric
Fabric Extensibility
Extensibility (Generally Available)
After six months in preview mode, gathering feedback, resolving bugs, and strengthening the platform, we’ve reached the next milestone. Partners and customers can build, validate, and publish custom Fabric workloads to production with full Microsoft support.
Key highlights:
- All core capabilities are stable and supported: OneLake storage, native item lifecycle, Entra token acquisition, iFrame relaxation, Workload Hub publishing.
- The Starter Kit ships with production-ready UI components (ItemEditor, WizardControl, OneLakeView, and more) that reduce time to first workload.
- GitHub Copilot integration and a new DevContainer/GitHub Codespaces setup reduce setup effort—no local machine required.
- The first Fabric Extensibility Community Contest drew strong community participation, with real workloads already appearing in the Workload Hub.
Learn more about Fabric Extensibility (Generally Available).
CI/CD & remote support (Preview)
Three new features further enhance the professional development experience for Fabric workloads.
CI/CD Support
Workload items are first-class citizens in Fabric’s CI/CD platform. Items participate in Git integration and Deployment Pipelines with no custom tooling. Variable Library support means items automatically pick up workspace-specific configuration (e.g., the right Lakehouse reference) when promoted across dev, test, and production—no hard-coded IDs, no manual reconfiguration.
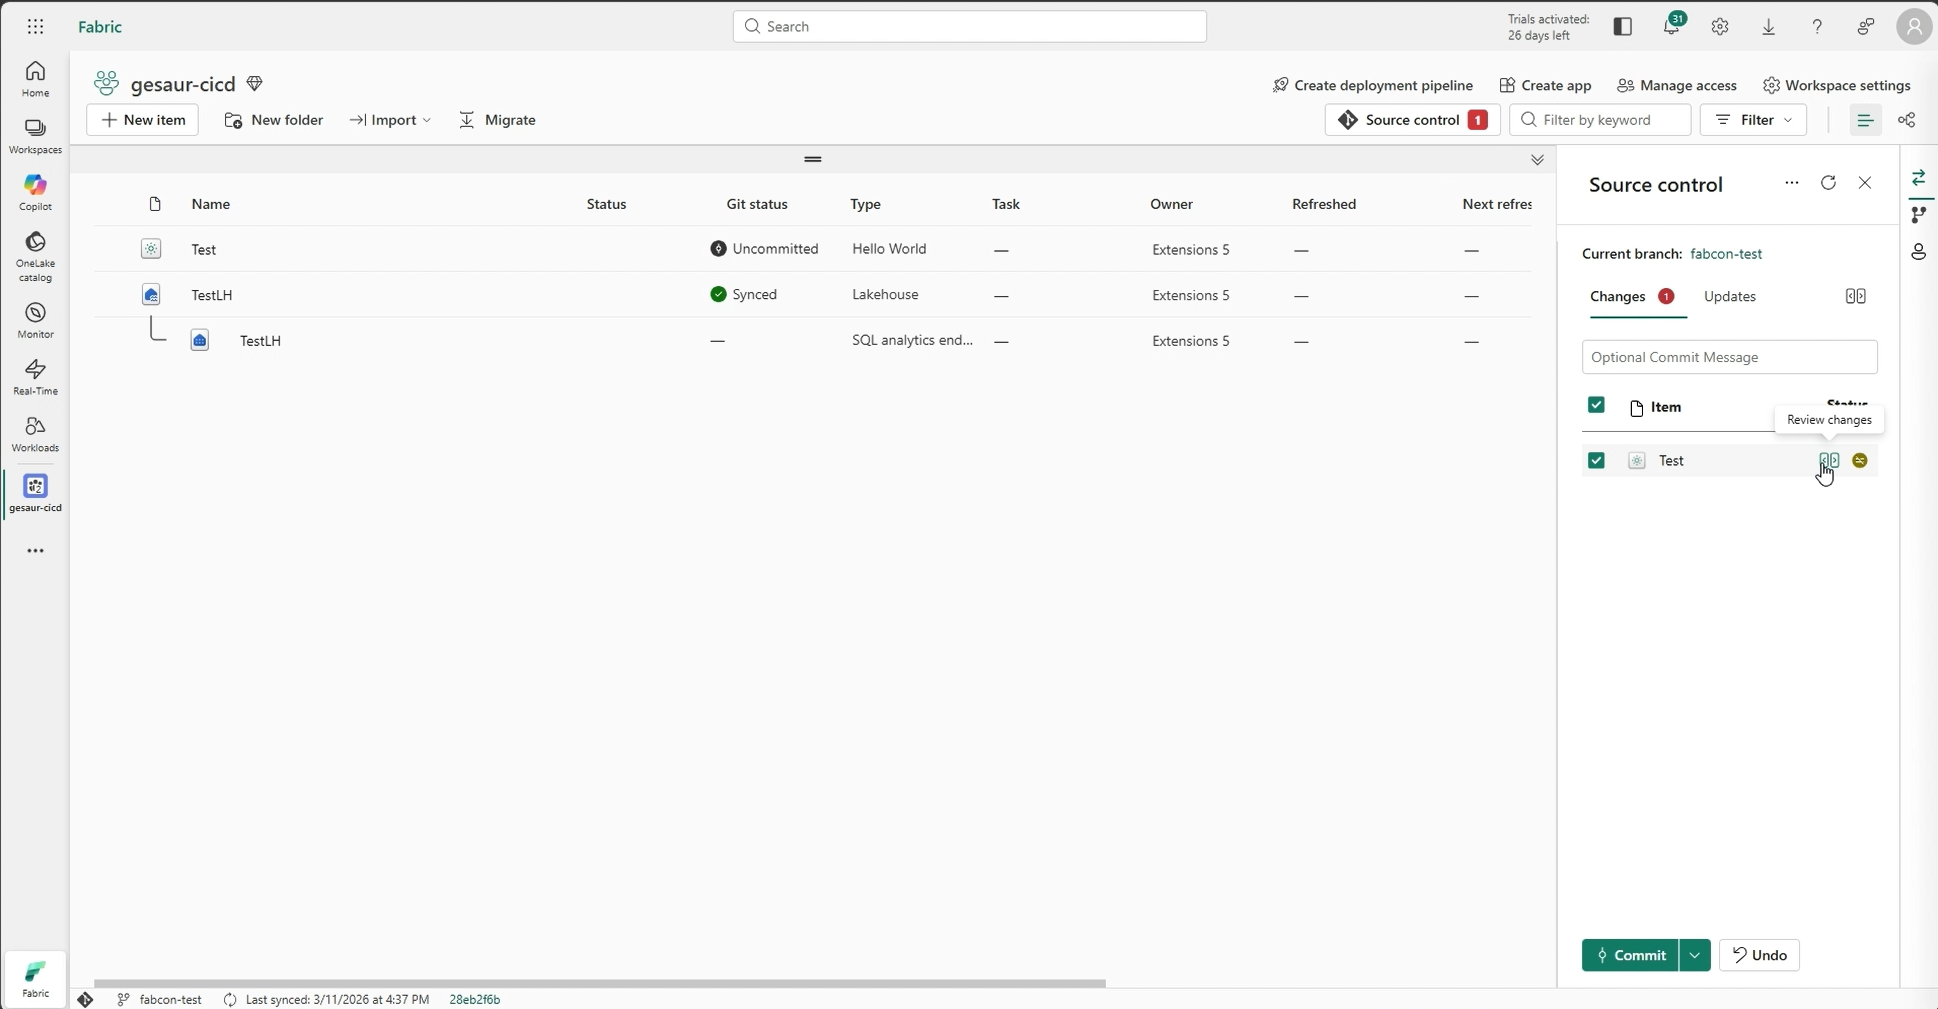
Figure: CICD enablement for Hello World Sample
Variable Library Support
Items can be read from Fabric’s Variable Library, allowing workspace-specific configuration (e.g., the right Lakehouse reference) to resolve automatically when an item is promoted across dev, test, and production stages—no hard-coded IDs, no manual reconfiguration, and no custom deployment hook logic required. An opt-in webhook that fires whenever a workload item is created, updated, or deleted—regardless of whether it happened through the UI, the REST API, or a CI/CD pipeline. It’s designed for licensing checks, infrastructure provisioning, and external system synchronization. There’s no impact on workloads that don’t register an endpoint.
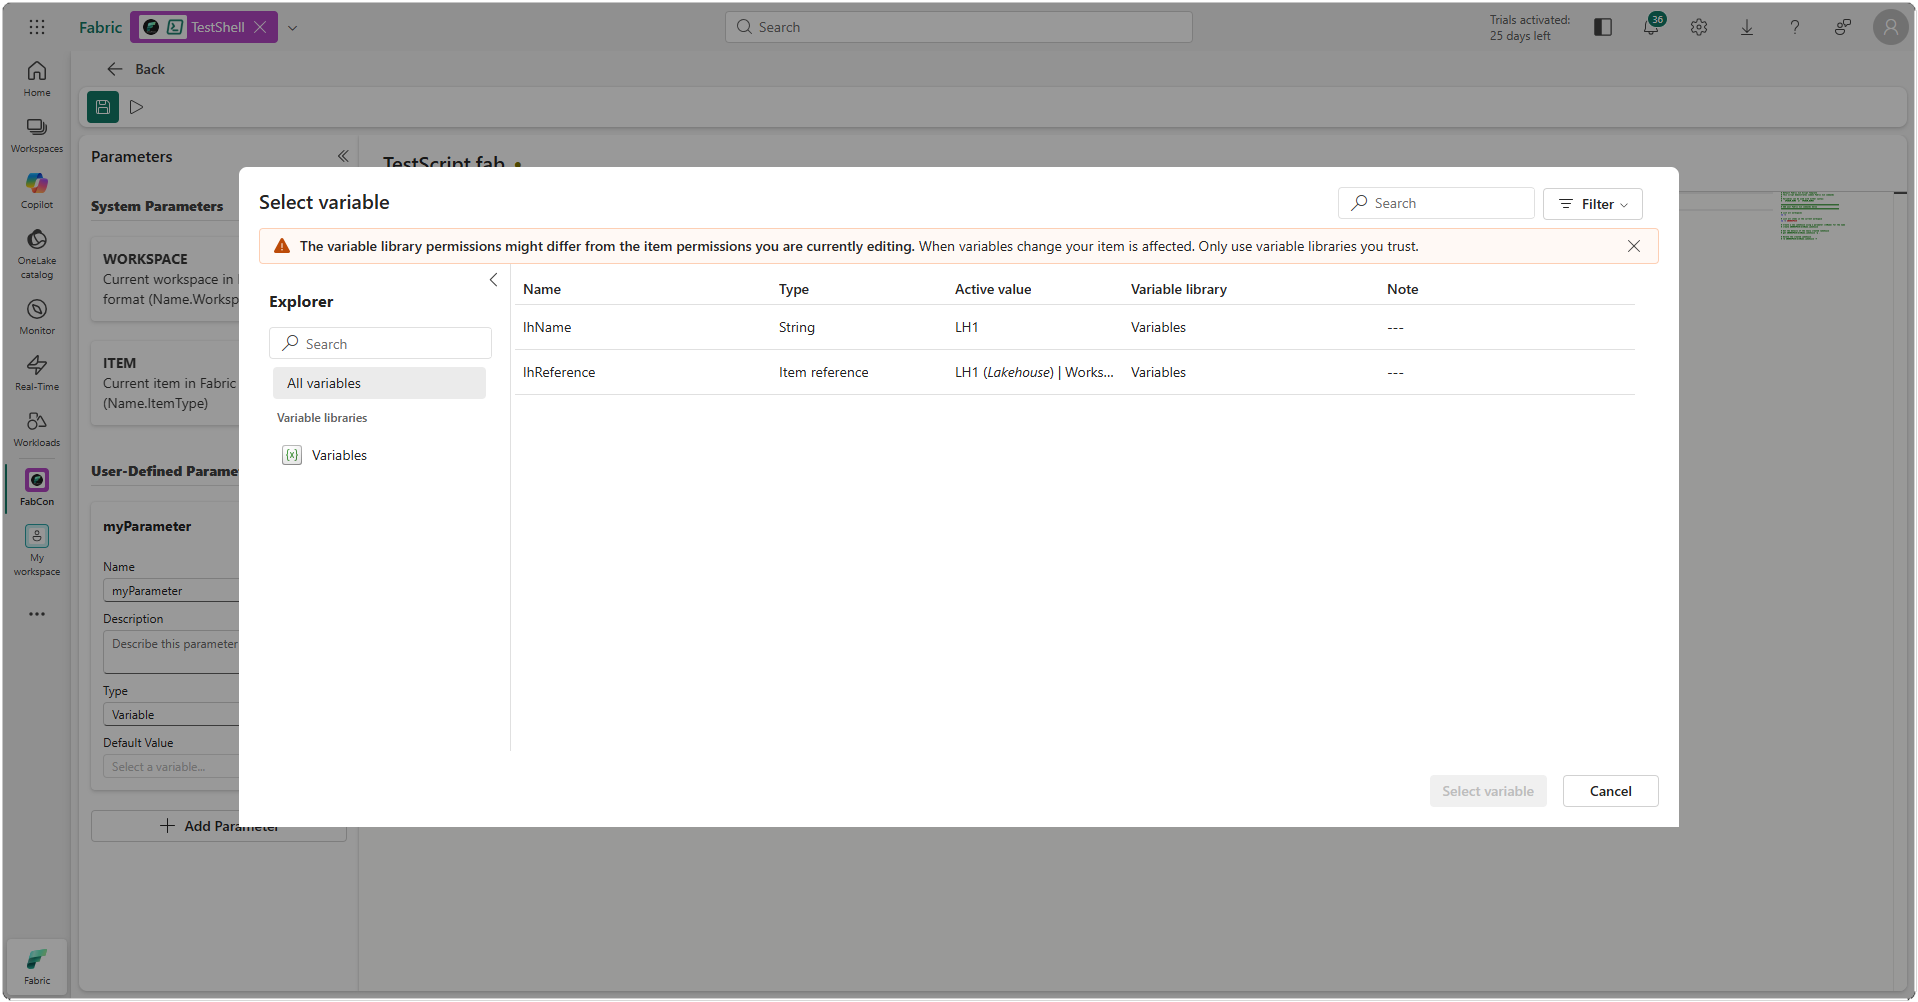
Figure: Variable Picker within Fabric Cloud Shell Item
Remote lifecycle notification API
Workloads are no longer just passive objects sitting in a workspace. The Remote Lifecycle Notification API is an opt-in capability—there is no requirement to use it. If your workload does not need backend notifications, you simply don’t register an endpoint, and everything works exactly as before.
Fabric Scheduler / Remote Jobs
This feature allows workload items to expose named job types that users can schedule directly from Fabric. When a scheduled job fires, Fabric calls a registered endpoint on your workload backend—passing along the item context and a delegated user token.
For all these features, you’ll find samples in the Toolkit Starter Kit. Learn more about Fabric Extensibility CI/CD and remote capabilities in this blog post.
What’s new in workload management
As the Fabric extensibility ecosystem grows, with partners publishing workloads and organizations building custom solutions, managing workloads at scale demands more than a single settings page. IT admins need centralized governance and a clear overview of what’s being used across the organization, and workspace teams need self-service agility.
Three key workload management features for Microsoft Fabric Extensibility will launch by April 1, 2026:
- Workload admin portal (Generally available)
- Add workload to workspace (Generally available)
- Workload management admin APIs (Preview)
These will enhance governance through portal, API, and self-service capabilities.
Admin portal: centralized admin workload overview (Generally Available)
The Fabric Admin Portal now includes a dedicated Manage Workloads tab, a single pane of glass for workload governance across your organization.
- Centralized workload visibility: view all workloads available for assignment in your tenant in a single centralized view, including status information and workload details.
- Tenant assignment controls: manage workload assignment at the tenant and workspace level.
Add workload to workspace (Generally available)
The workspace-level workload assignment was previously introduced in Preview. It allows workspace admins to add workloads directly to one or more workspaces.
How it works (Workspace admins):
- Navigate to the Workload Hub from the left menu in Microsoft Fabric or from your workspace settings.
- Browse or search for the workload you want to add.
- Select “Add Workload” and select “To Workspace” from the dropdown.
- Select your workspaces: search, check the workspaces you want, and use “View more/less” to manage the list.
- Select “Add”: the workload is immediately available in your selected workspaces.
Workload Management Admin APIs: Overview and Control at Scale (Preview)
- Capabilities For Fabric admins who need a programmatic view of their workload landscape, the new Workload Management Admin APIs provide governance and oversight across the tenant through a REST interface.
- List all workloads: view all workloads available to be added in the tenant, and view which workloads were added.
- List all workload assignments in the tenant. Drill down into a specific workload and view where it was added (tenant, workspace, capacity).
- Manage workload assignments (add or remove) to capacities, workspaces, and tenant.
Self-service workload publishing (Generally Available)
A frequent question from ISV partners using the Microsoft Fabric Extensibility Toolkit is: “How do I get started publishing?”
Key features
Self-service workload publishing is expected to be generally available by the end of March 2026. ISV partners will be able to publish workloads directly to selected customer tenants for private preview without requiring a manual submission request. This can accelerate time to market and support faster iteration with customers.
Self-Service Workload Publishing gives ISV partners full control over their private preview journey:
- Publish to up to 20 customer tenants: share your workload with selected customers for testing and validation, no Microsoft certification required.
- Workload name reservation: reserve your globally unique workload name (e.g., Contoso.DataQuality) to protect your brand identity before formal publication.
- Automated validation: your workload package is automatically validated against manifest schema, naming conventions, and security requirements at upload time.
- Seamless path to general availability: once validated with customers, use the same workload package to pursue formal certification and publish to the global Workload Hub.
OneLake
Third-party support for OneLake security
This month, we announced third‑party support for OneLake security, taking an important step toward interoperable data security. As customers increasingly build lake‑first architectures on open formats like Delta and Iceberg, they expect the freedom to use multiple analytics engines without copying data or redefining security. OneLake security addresses this need by enabling security to be defined once and enforced consistently wherever data is accessed.
At the core of this capability is the authorized engine model. Security policies—including role‑based permissions, row‑level security (RLS), and column‑level security (CLS)—are centrally defined and managed in OneLake, while enforcement happens at query time inside the engine reading the data. Authorized third‑party engines securely retrieve the relevant metadata and effective security definitions through OneLake APIs and apply them during query execution. This ensures users see only the rows and columns they are permitted to access, while OneLake remains the single source of truth for access control.
To support adoption, we’ve published implementation guidance and setup documentation for both engine builders and users. The APIs are designed to be engine-agnostic and easy to integrate by providing pre-computed effective access definitions. Looking ahead, we’ll continue evolving OneLake security APIs, including adding support for bitmap-based RLS enforcement. With this release, data vendors can integrate directly with OneLake security, customers can maintain a single security model, and users gain the flexibility to query OneLake data using the engines of their choice.
OneLake file explorer (Generally Available)
You can easily access and organize all your OneLake data from Windows using the OneLake file explorer. The file explorer lets you browse every workspace and data asset, and upload, download, or edit these files using the same familiar experience as OneDrive. By bringing data lakes into the Windows file system, the file explorer makes enterprise data more accessible for business users.
Data Engineering
Fabric Runtime 2.0 (Preview)
- Fabric Runtime 2.0 (Preview) is a next-generation runtime that is purpose-built for large-scale data computations in Microsoft Fabric and introduces key features and components that enable scalable analytics and advanced workloads. Apache Spark: 4.0
- Components include Operating System: Azure Linux 3.0 (Mariner 3.0)
- Java: 21
- Scala: 2.13
- Python: 3.12
- Delta Lake: 4.0
This screenshot demonstrates how you can switch to Runtime 2.0 at the Workspace settings and the Environment levels.
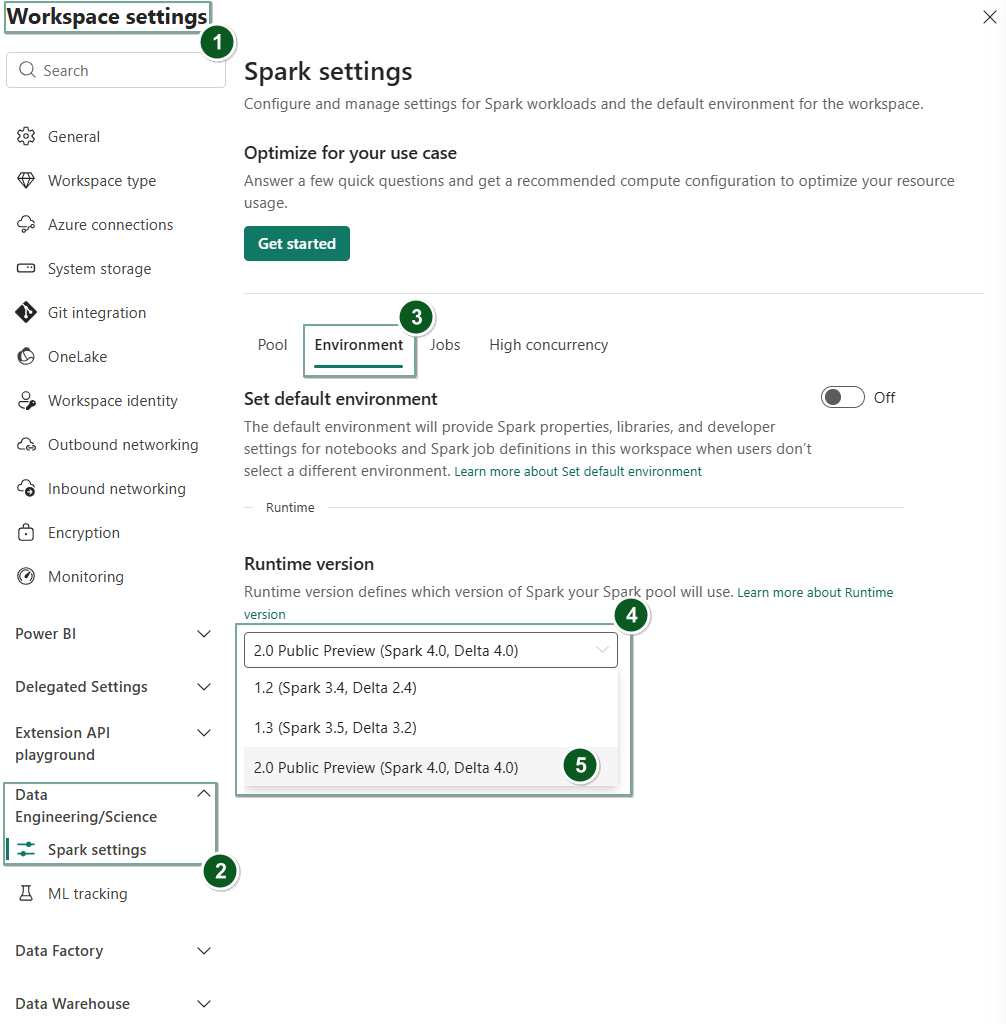
Figure: Change runtime at the workspace settings level
Explore the full documentation and start using Runtime 2.0 in Fabric.
Custom Live Pools for Fabric Data Engineering
Modern data engineering workloads are rarely one‑size‑fits‑all. Teams often need predictable performance, isolated resources, or customized configurations for critical production pipelines and high‑value interactive development.
- At the same time, Spark session startup times can degrade in real-world enterprise environments, especially when users have custom library dependencies.
- Workspaces or tenants are secured with Private Links or Managed Private Endpoints.
In these scenarios, Spark clusters must be created on demand within strict network boundaries, and libraries need to be resolved and installed dynamically, adding noticeable startup latency.
Custom Live Pools address this challenge by introducing dedicated, long‑lived Spark pools that stay warm inside your network boundary and come preconfigured with the required dependencies.
With Custom Live Pools, Fabric Data Engineering now enables you to:
- Create dedicated Spark pools and schedule them tailored to your workload needs.
- Reduce session startup overhead by keeping pools warm with libraries preinstalled.
- Run reliably within Managed VNets and Private Link–enabled environments.
Figure: Animated GIF demonstrating the setup of custom live pools in an Environment
Because these pools are already provisioned within the workspace’s network boundary and fully initialized with dependencies, users can start working immediately, without paying the repeated cost of cluster spin‑up and library installation.
Custom Live Pools are ideal for:
- Production pipelines that require consistent SLAs.
- High‑value interactive notebooks used by data developers.
- Teams operating in secure or regulated environments.
How to set up a Custom Live Pool:
- Navigate to your Compute tab in your Environment.
- Select Spark pool and enable the option for Live Pool.
- Specify the Schedule, Time period of inactivity, and Retrigger frequency.
Job concurrency and queue monitoring experience for Fabric Data Engineering
As organizations scale their Fabric usage, understanding what’s running, what’s queued, and why becomes essential.
- The new job concurrency and queue monitoring experience delivers deep visibility into Spark workload execution across your environment.
- View active, queued, and completed jobs in a single place.
- Understand why jobs are queued and how concurrency limits are applied.
- Identify bottlenecks caused by capacity or concurrency constraints.
- Make informed decisions to tune workload scheduling and resource allocation.
Figure: GIF demonstrating the new job concurrency and queue monitoring view in the Data Engineering/Science Spark settings page of Workspace settings
Accessing workspace monitoring
To view concurrency and queue signals for your specific workspace:
- Navigate to Workspace settings.
- Select Data Engineering/Science > Spark settings.
- Select Jobs to view the live view of your workspace level Spark queue and concurrency.
Resource Profiles for Fabric Data Engineering
Modern data engineering teams shouldn’t need to be Spark experts to get great performance. With Resource Profiles in Fabric Data Engineering, users simply describe what they’re trying to do, and Fabric automatically recommends the optimal compute configuration.
Figure: GIF demonstrating the new resource profiles experience in workspace settings
Simple inputs, smart recommendations
Instead of tuning dozens of Spark settings, users provide a few high‑level workload details through an intuitive UI:
- Primary use case, such as a specific medallion layer (Bronze, Silver, or Gold) or task‑based optimization (read‑heavy or write‑heavy workloads).
- Typical data volume.
- Data characteristics, such as whether input data contains many small files.
- Maximum capacity units (CU) for the Spark pool.
Once these inputs are provided, users select Get recommendation, and Fabric automatically generates an optimized configuration tailored to that workload.
Based on the inputs shown above, Fabric recommends:
- The appropriate Resource profile.
- Node family and size.
- Autoscale and dynamic executor settings.
- Optimized Spark driver and executor cores and memory.
- A compatible runtime version.
All recommendations are derived from proven best practices and internal performance tuning, removing guesswork and trial‑and‑error.
Where to configure
Users can enable and manage Resource Profiles from workspace settings:
- Go to Workspace settings > Data Engineering and Data Science > Resource optimization.
- Select or edit the optimized profile for the workspace.
- Rerun the Optimize for your use case flow as workloads evolve.
- Apply consistent configurations across all Spark workloads in the workspace.
Once configured, all notebooks and pipeline‑triggered Spark jobs inherit these optimized settings automatically, without requiring per‑notebook configuration.
Why this matters
This experience enables:
- Performance by default: optimized compute without manual tuning.
- Consistency: the same performance characteristics across users and jobs.
- Better price‑performance: right‑sized resources aligned to workload intent.
- Lower operational overhead: fewer tuning cycles and support escalations.
As workloads change over time, teams can simply revisit the optimization flow, update a few inputs, and let Fabric adapt the configuration—without rewriting code or Spark settings.
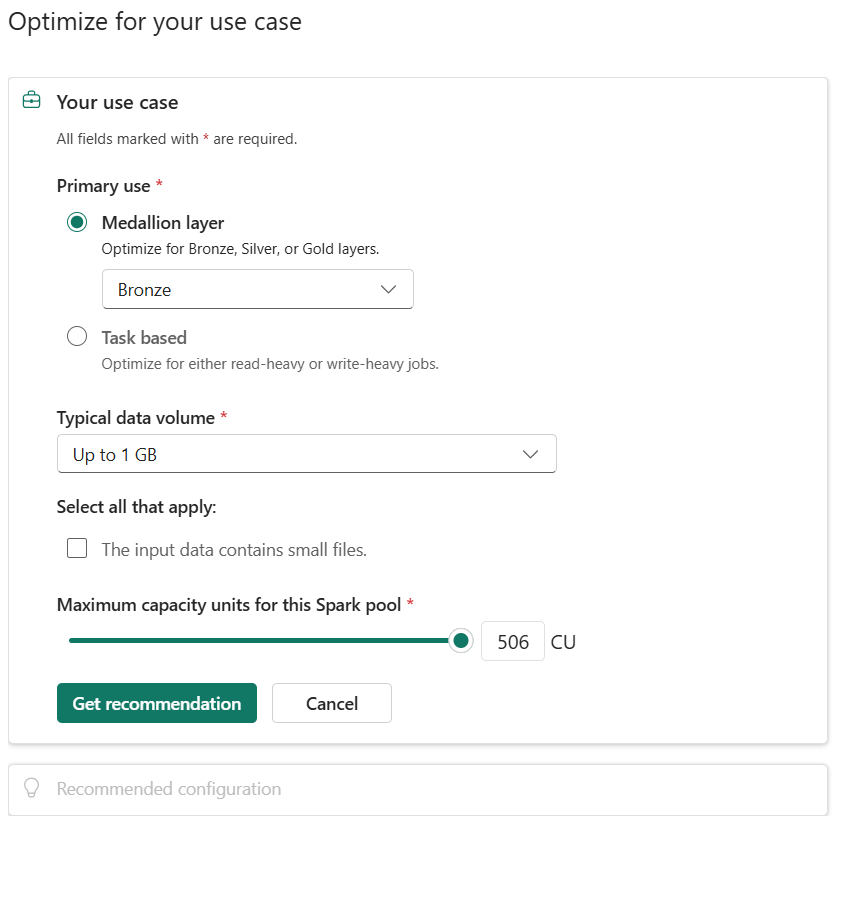
Figure: Introduction to Resource Profiles Experience
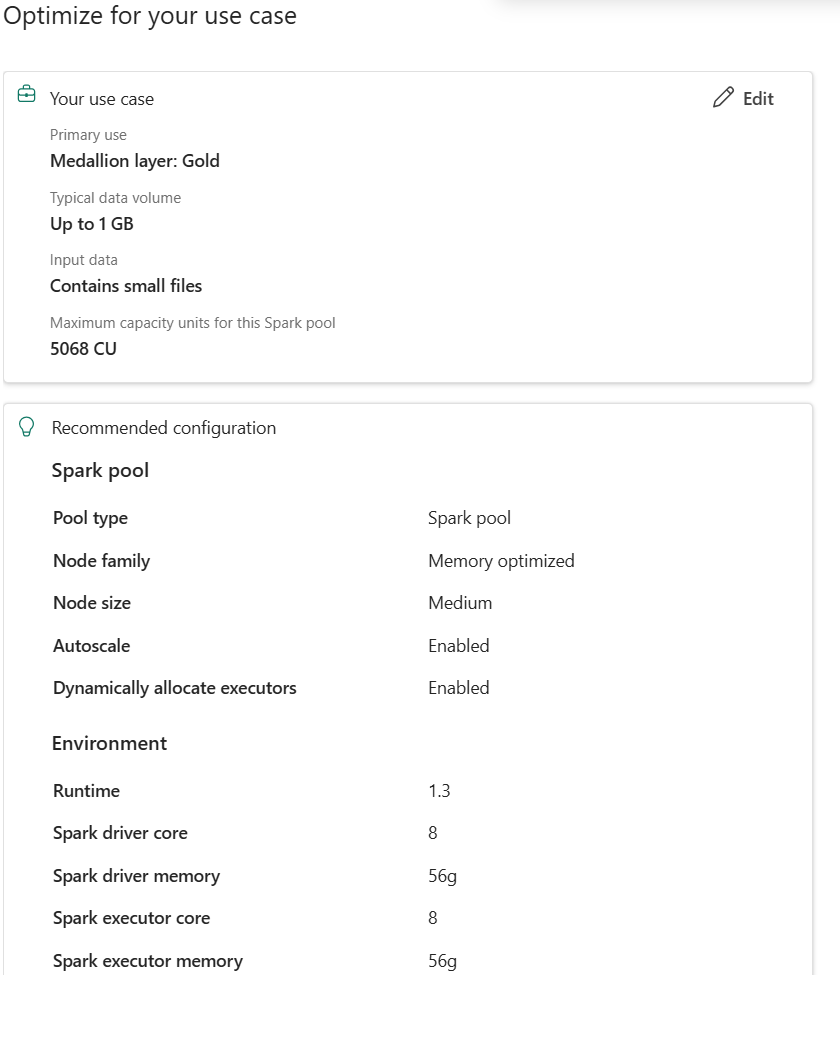
Figure: Recommendations generated based on user inputs
To learn more about the Resource Profiles experience in Microsoft Fabric Data Engineering, refer to the Microsoft Learn documentation.
Installing libraries with Quick mode in Spark Environment (Preview)
Managing libraries shouldn’t slow down your development workflow. In Microsoft Fabric Environments, we’re introducing a more efficient way to iterate on libraries while keeping production workloads stable and reliable.
Fabric Environments now support two complementary library installation modes that you can use side by side:
- Quick mode: a fast, on-demand installation path designed for development and experimentation, where libraries are installed when a notebook runs. This avoids heavy processing during the environment publishing and significantly reduces publish time and notebook startup latency when you’re iterating on lightweight or frequently changing dependencies.
- Full mode: a snapshot‑based installation path optimized for production workloads and pipelines, where libraries are fully resolved, validated against the Spark runtime, and published as a stable snapshot to ensure consistency and reproducibility.
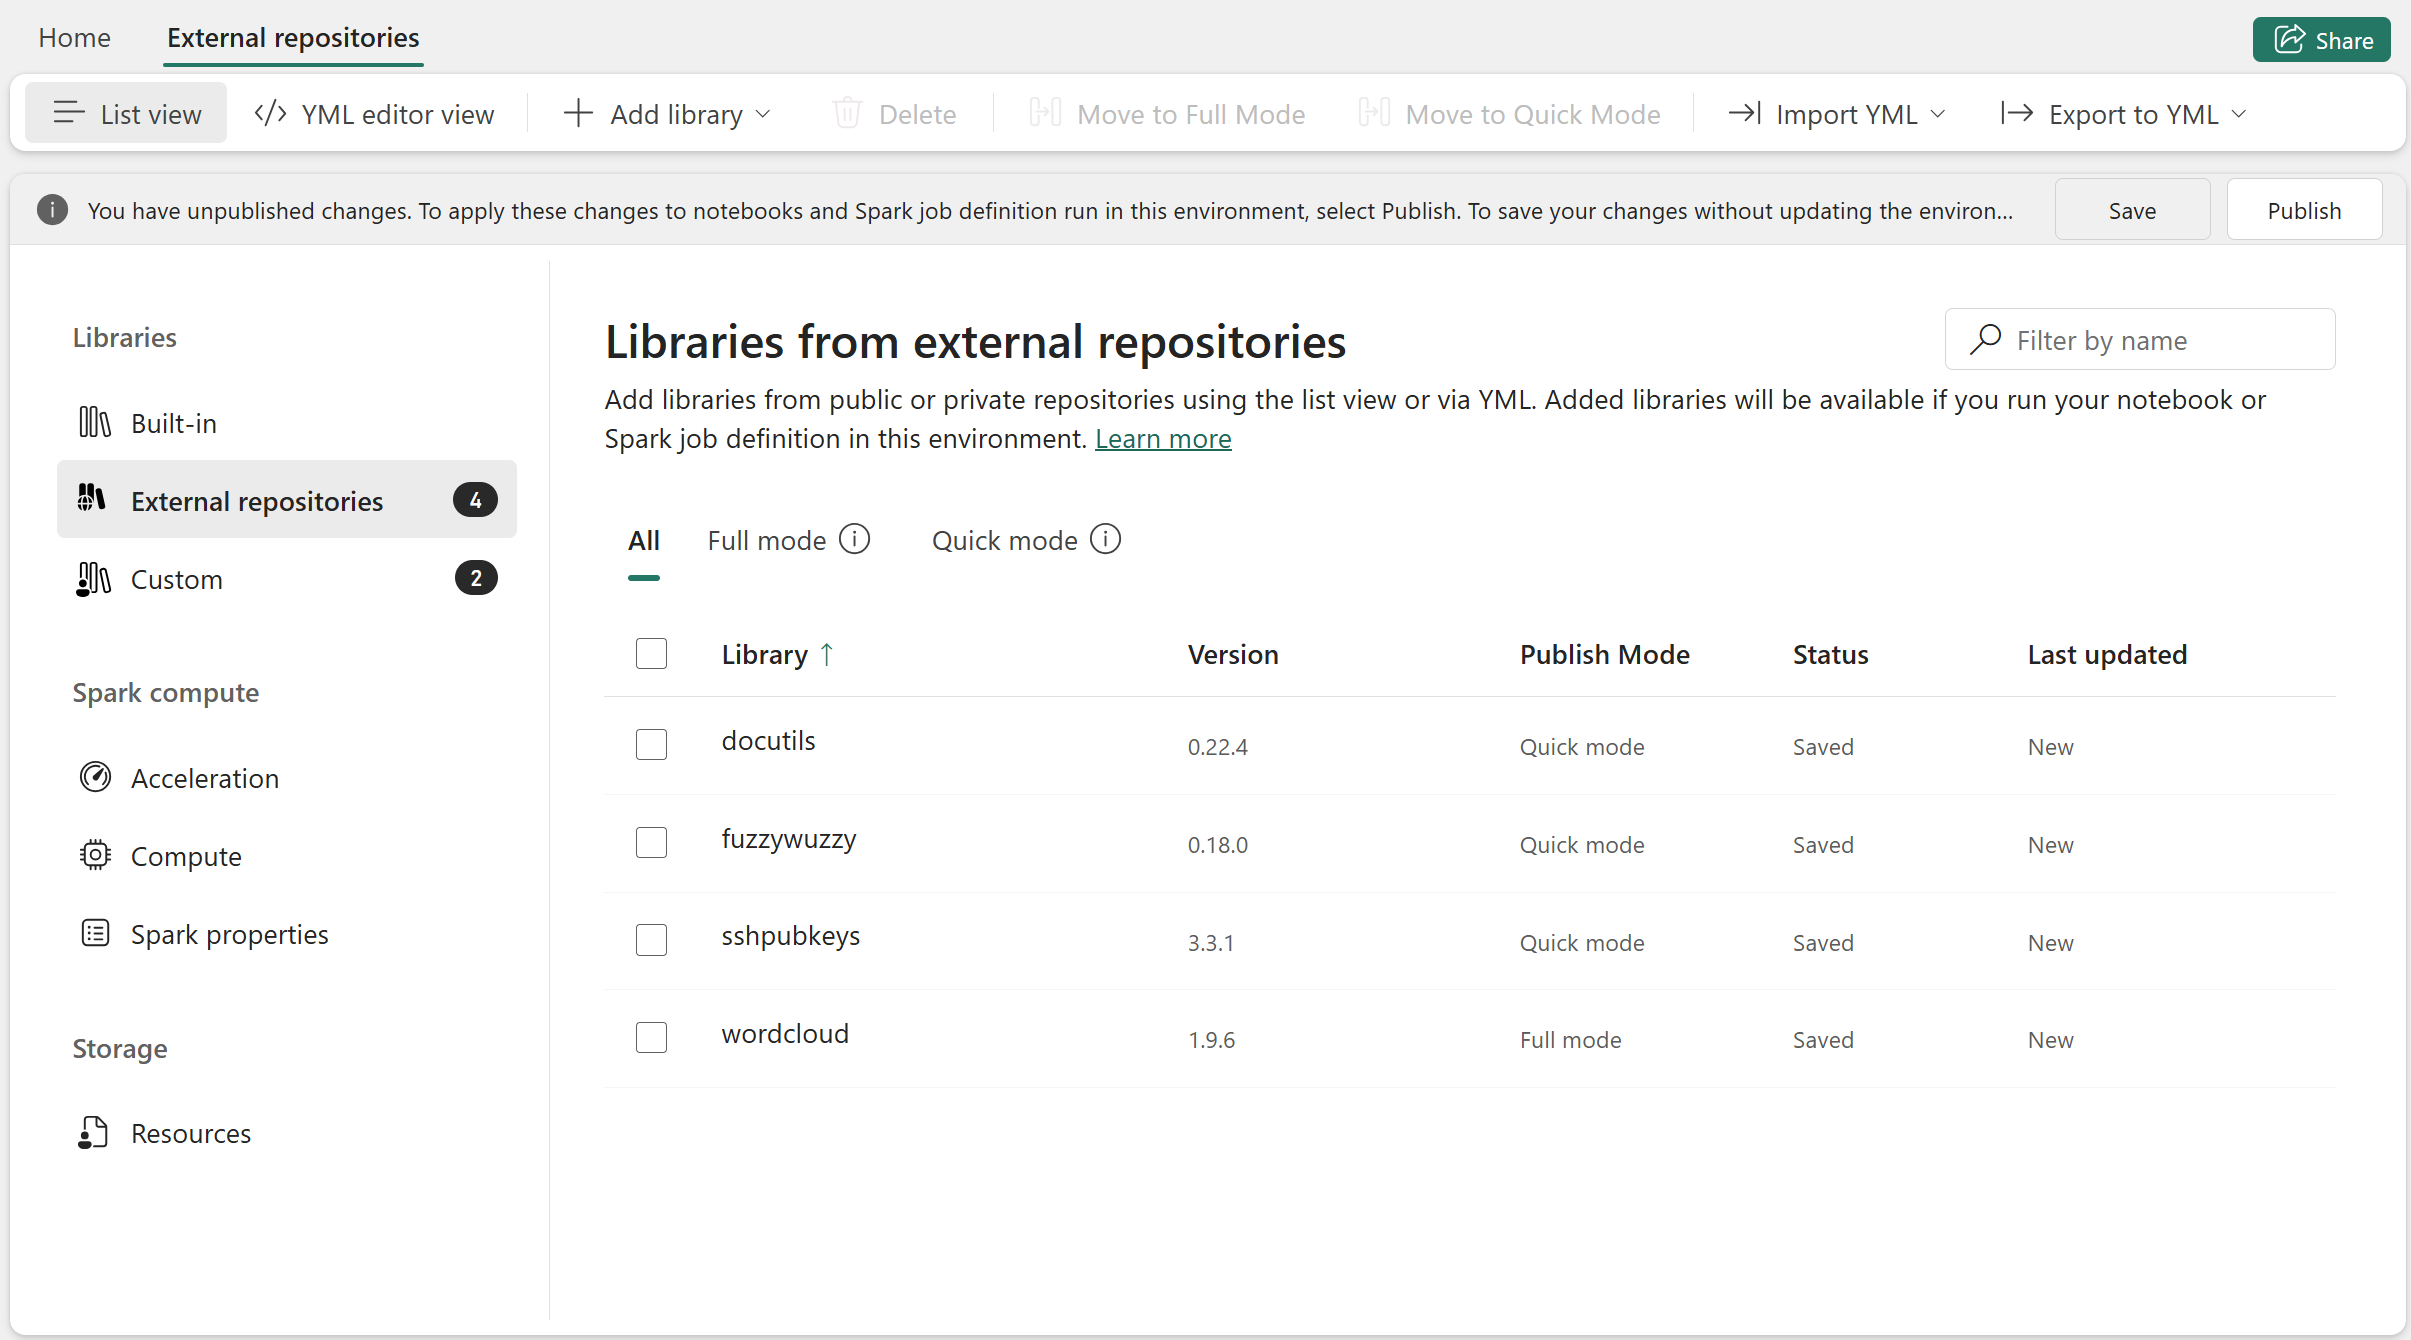
Figure: Add libraries in Quick mode and Full mode
This new feature lets you move faster during development without compromising production stability. You can keep your core, production‑ready libraries in the snapshot‑based mode, while using the on‑demand path to quickly test new packages or iterate on custom libraries, all within the same Environment.
Dynamic session sharing limit up to 50 for high concurrency
Fabric High Concurrency Spark sessions enable both interactive exploration and large‑scale, pipeline‑driven notebook execution, supporting parallel, scheduled, and event‑driven workloads at enterprise scale.
Customers often achieve higher density by packing notebooks into a shared High Concurrency (HC) session using session tags, effectively fitting up to five notebooks per session to control startup overhead and cost. While effective, this approach relies on static limits and manual tuning.
With this update, Fabric Data Engineering allows the maximum number of notebooks attached to a High Concurrency session to be increased up to 50, enabling dynamic session sharing at much higher scale.
Where to set the configuration
You can set the configuration in the Environment item that your notebooks or pipeline‑triggered notebooks use:
- Go to Workspace → Environments
- Select the Environment attached to your notebook or pipeline
- Open Spark Properties
- Add the High Concurrency configuration
- Set spark.highConcurrency.max to a value between 2 – 50
Note: This update does not change the default limit of five.
This enables:
- Interactive notebooks, used for exploratory analysis and collaboration.
- Notebook jobs triggered by pipelines, running in parallel within shared HC sessions.
- Dynamic adjustment of session sharing limits based on workload intensity, cost, and price‑performance goals.
By increasing the session sharing limit, customers can:
- Improve session acquisition times during peak load.
- Increase notebook density without fragmenting sessions.
- Tune concurrency to match workload demand rather than fixed defaults.
- Achieve better price‑performance efficiency while preserving isolation and fairness across jobs.
To learn more about increasing your session sharing limit in High Concurrency mode, please check out Microsoft Learn documentation.
Data export settings for notebooks
With data export settings for notebooks, Microsoft Fabric empowers administrators with explicit, tenant-level control over how data leaves notebooks. This feature helps ensure that interactive analytics do not inadvertently become channels for data exfiltration. Administrators can restrict the downloading of notebooks, preventing files that may contain sensitive data, credentials, or proprietary logic from leaving the environment.
Additionally, they can disable downloads of rich output content, such as table results generated from DataFrames, within the notebook experience. By managing these controls, Fabric admins can effectively prevent unintended data exfiltration from interactive notebook workflows and consistently enforce security and compliance policies across all workspaces and teams.
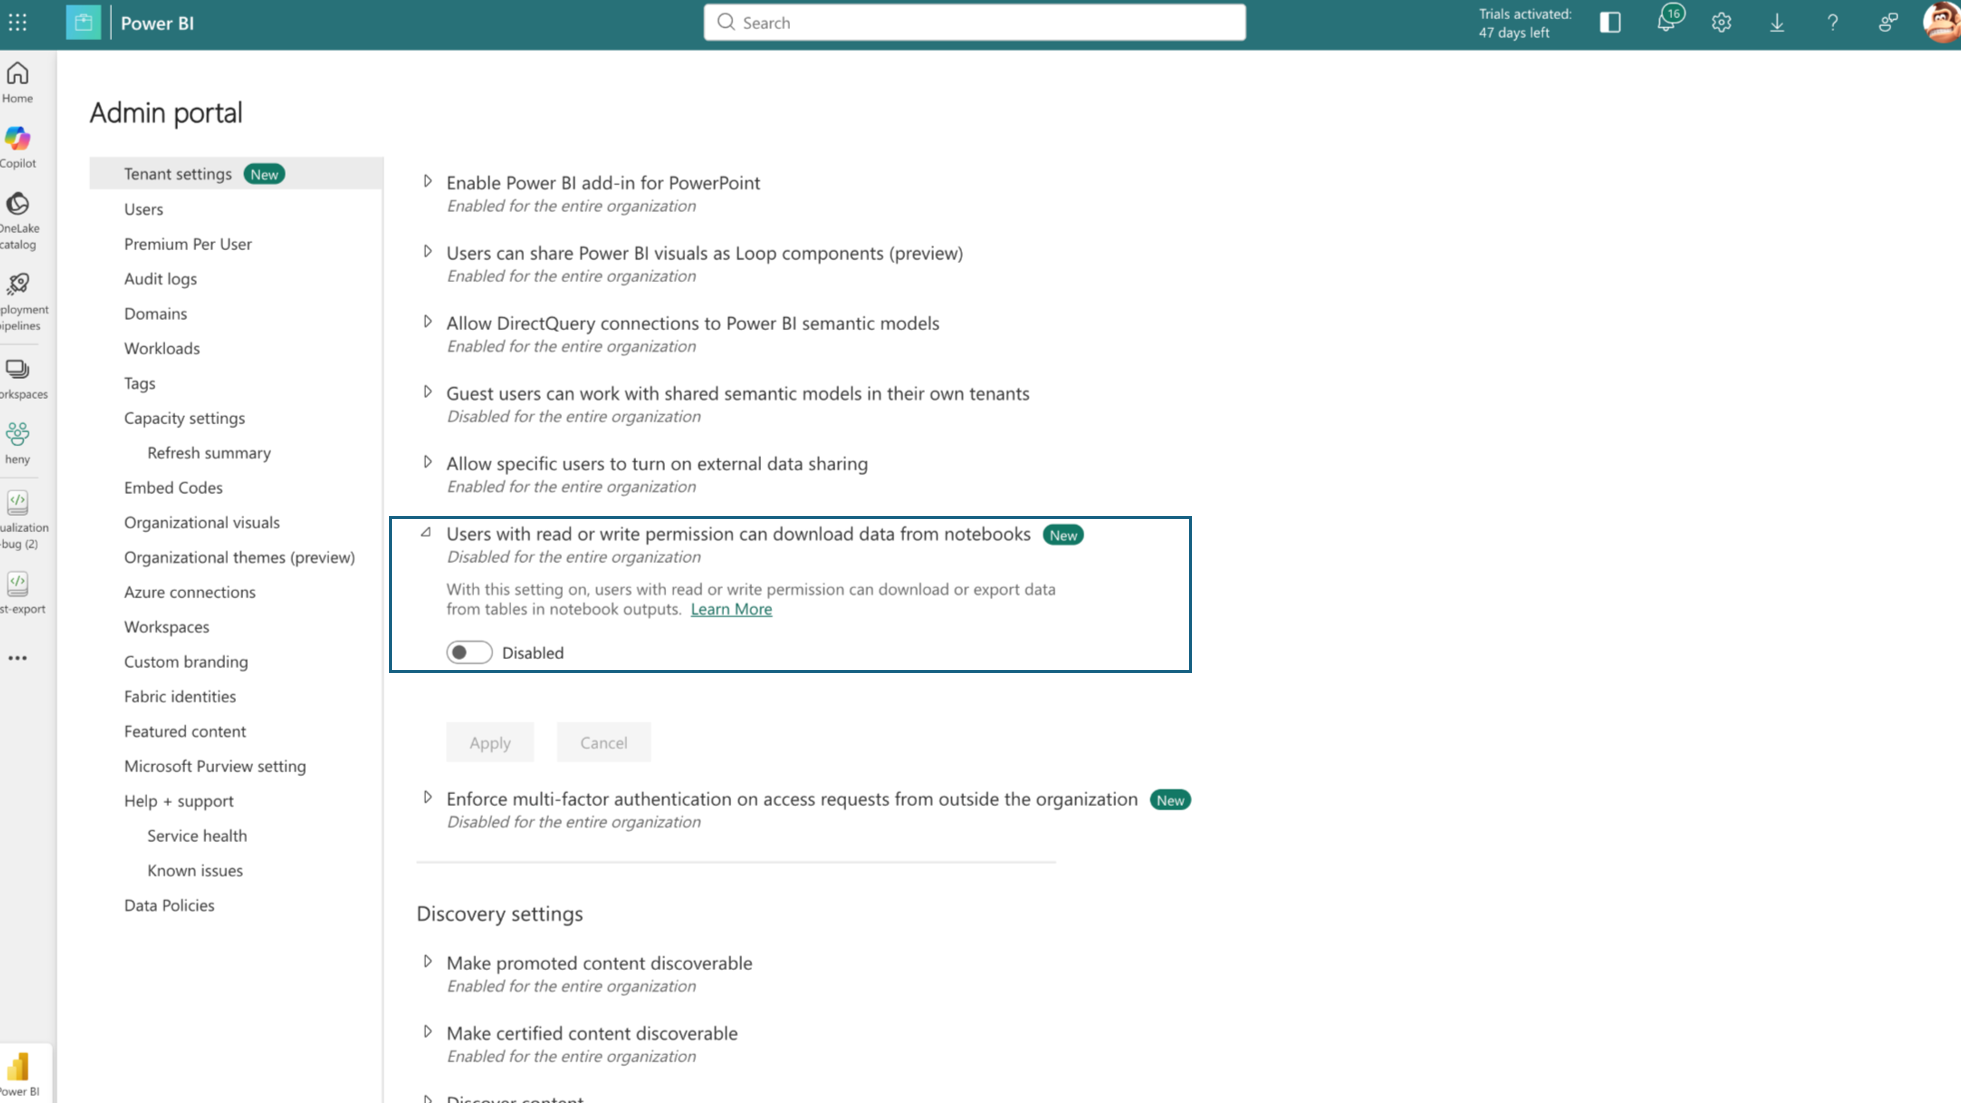
Figure: New data export tenant setting for notebooks
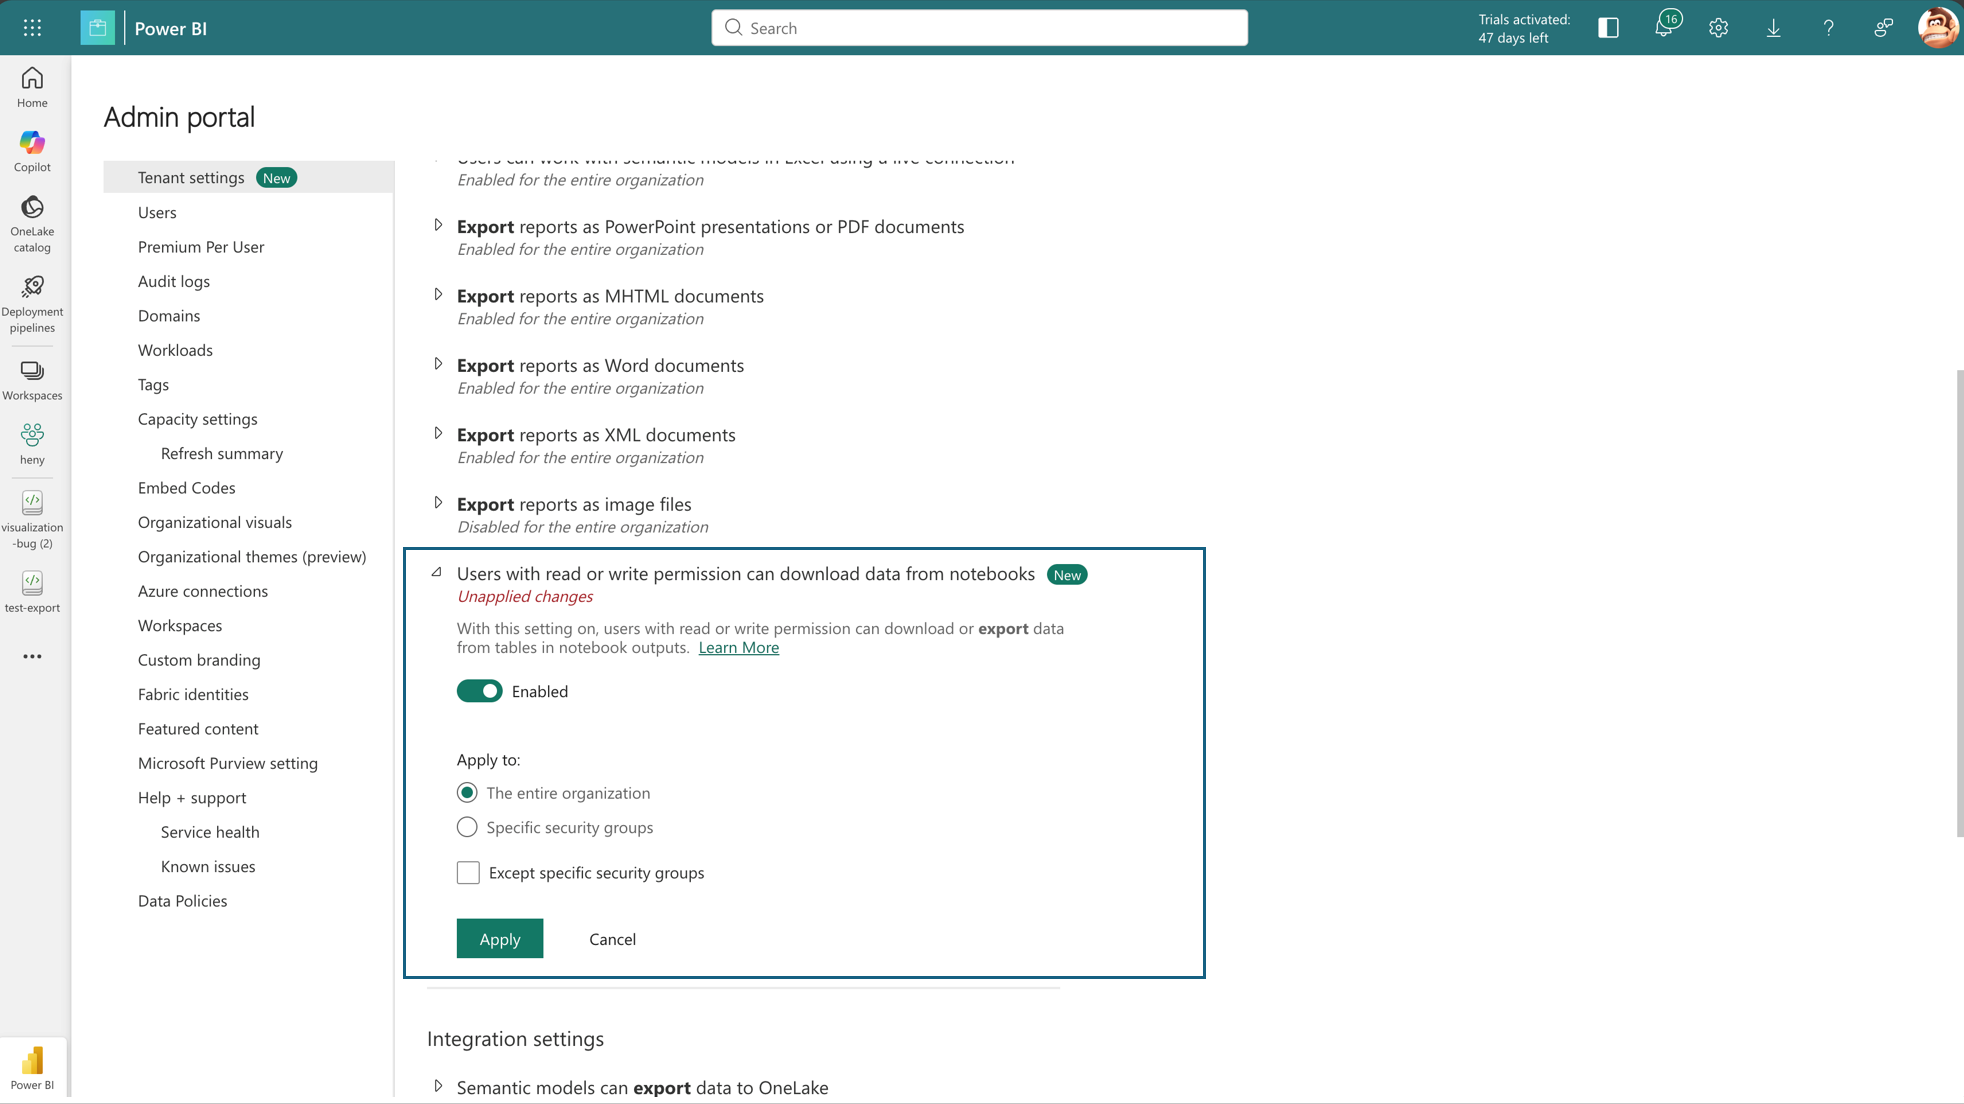
Figure: New data export tenant setting enabled
What users experience when downloads are blocked
When an administrator blocks data export:
- The Download option is removed from the notebook UI.
- Users can no longer download notebook files or rich output content generated from DataFrames in the notebook experience.
- Interactive exploration continues in‑place, but data cannot be extracted outside Fabric through the notebook UI.
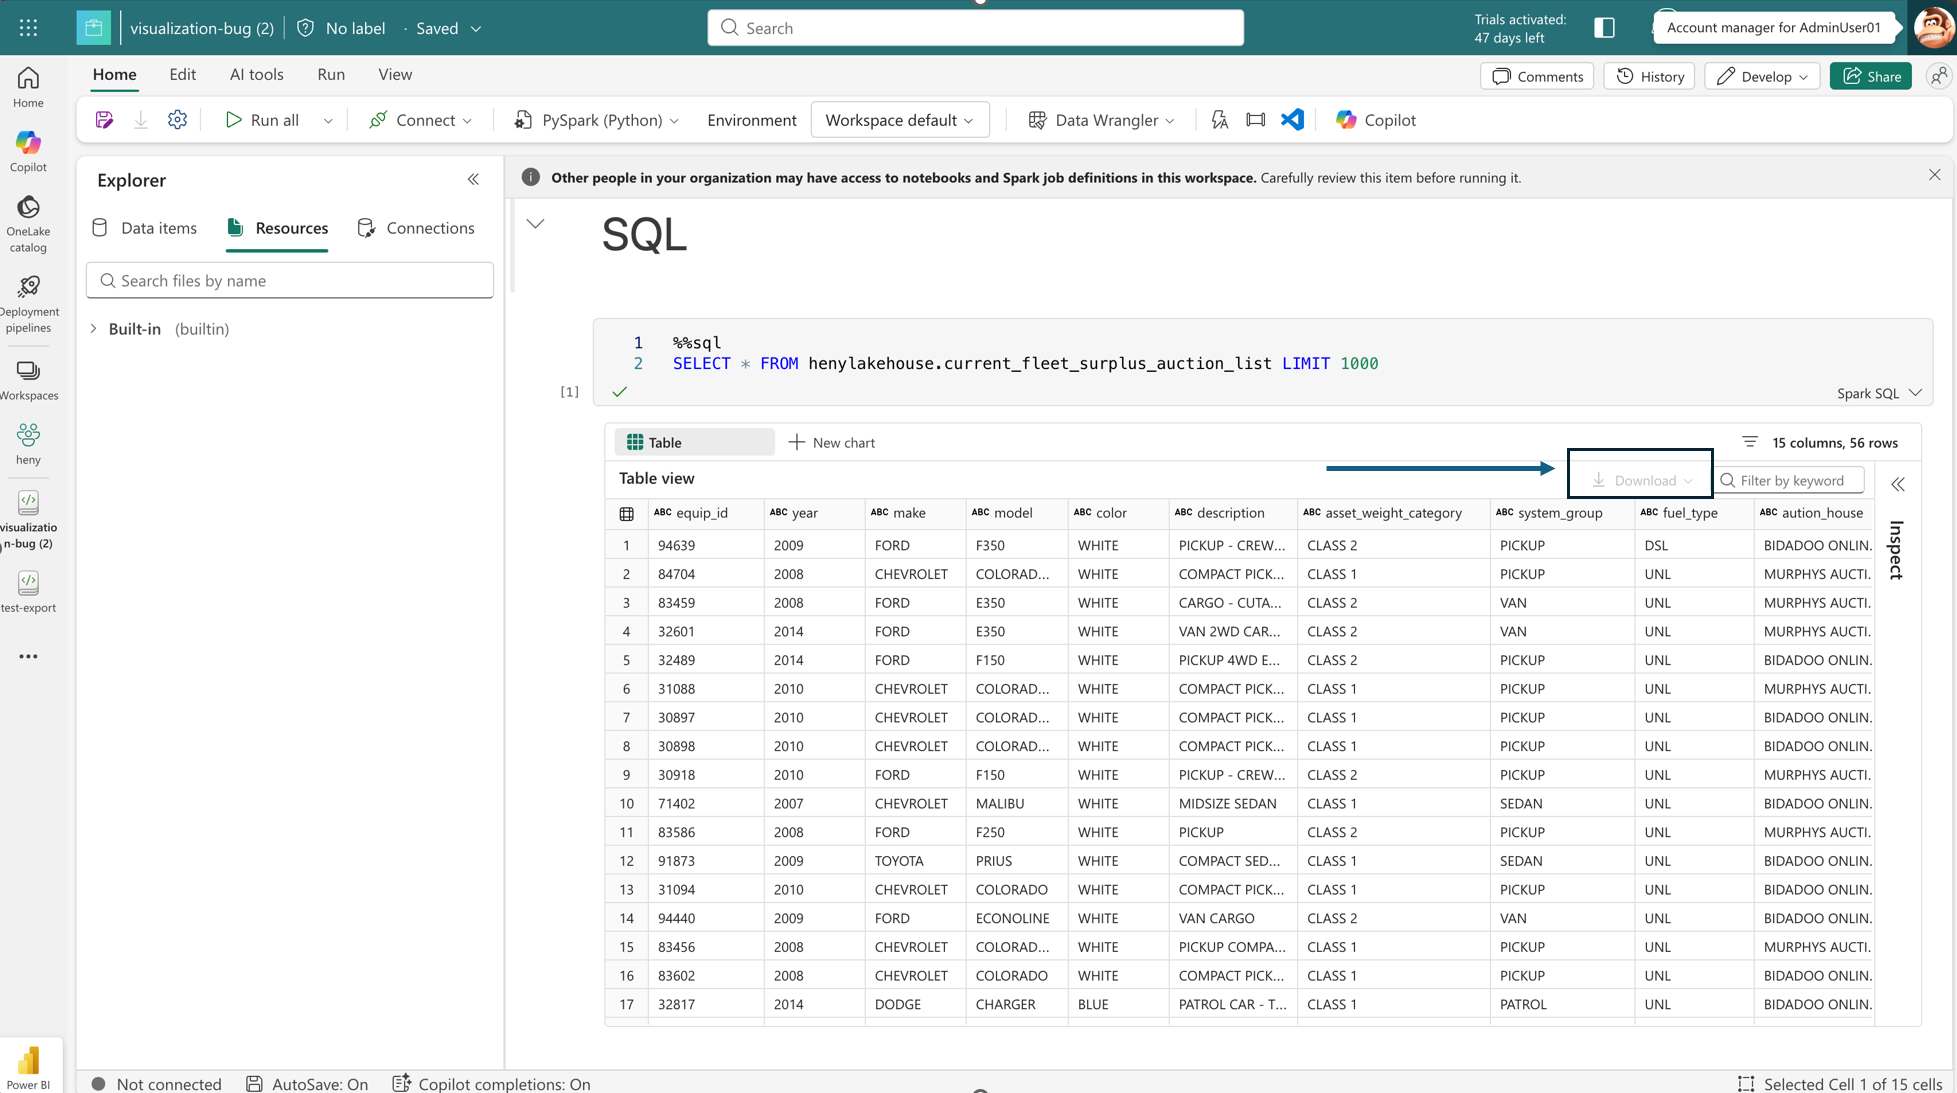
Figure: Notebook with download controls disabled due to tenant-level enforcement
This ensures that notebooks remain a secure analysis surface, rather than a data export mechanism, without disrupting day‑to‑day exploration inside the platform.
Why this matters
Notebooks often contain more than just code:
- Embedded datasets
- Derived analytical results
- Business logic
- Confidential insights
By controlling export behavior at the platform level, Fabric helps organizations:
- Reduce risk of accidental data leakage.
- Meet regulatory and audit requirements.
- Standardize governance across teams and regions.
Data Export Settings for Notebooks reinforce Fabric’s commitment to secure‑by‑default analytics, enabling powerful interactive experiences without compromising enterprise security posture.
Session starts insights into Fabric Data Engineering
Fast session startup is critical for interactive analytics, and Fabric’s Starter Pools are designed to deliver Spark sessions in ~5 seconds by default. However, when that target isn’t met, users have historically had little visibility into why.
Session Start Insights closes that gap by making session acquisition transparent, debuggable, and actionable.
Why sessions don’t always start in five seconds
In practice, session startup delays are almost always driven by user‑side configurations, not platform regressions. Common causes include:
- Custom compute configurations that prevent reuse of pre‑warmed Starter Pools.
- Pre‑installed libraries or environment dependencies that require cluster customization.
- Managed VNets or private networking that force isolated cluster provisioning.
- Unexpected high regional demand triggering fallback to on‑demand clusters.
What Session Start Insights delivers
Previously, users could see that a session was “starting,” but not what was happening under the hood. With this feature, Fabric surfaces clear, explicit reasons for session startup behavior directly in the product experience:
- Whether the session was served from a Starter Pool or required an on‑demand cluster.
- The exact reason a fast‑path session could not be used (for example, libraries, networking, or custom configs).
- Where time was spent during session acquisition.
Using the session detail view to diagnose delays
- Navigate to the notebook’s session status or monitoring pane.
- Open Session Details for the active or recent session.
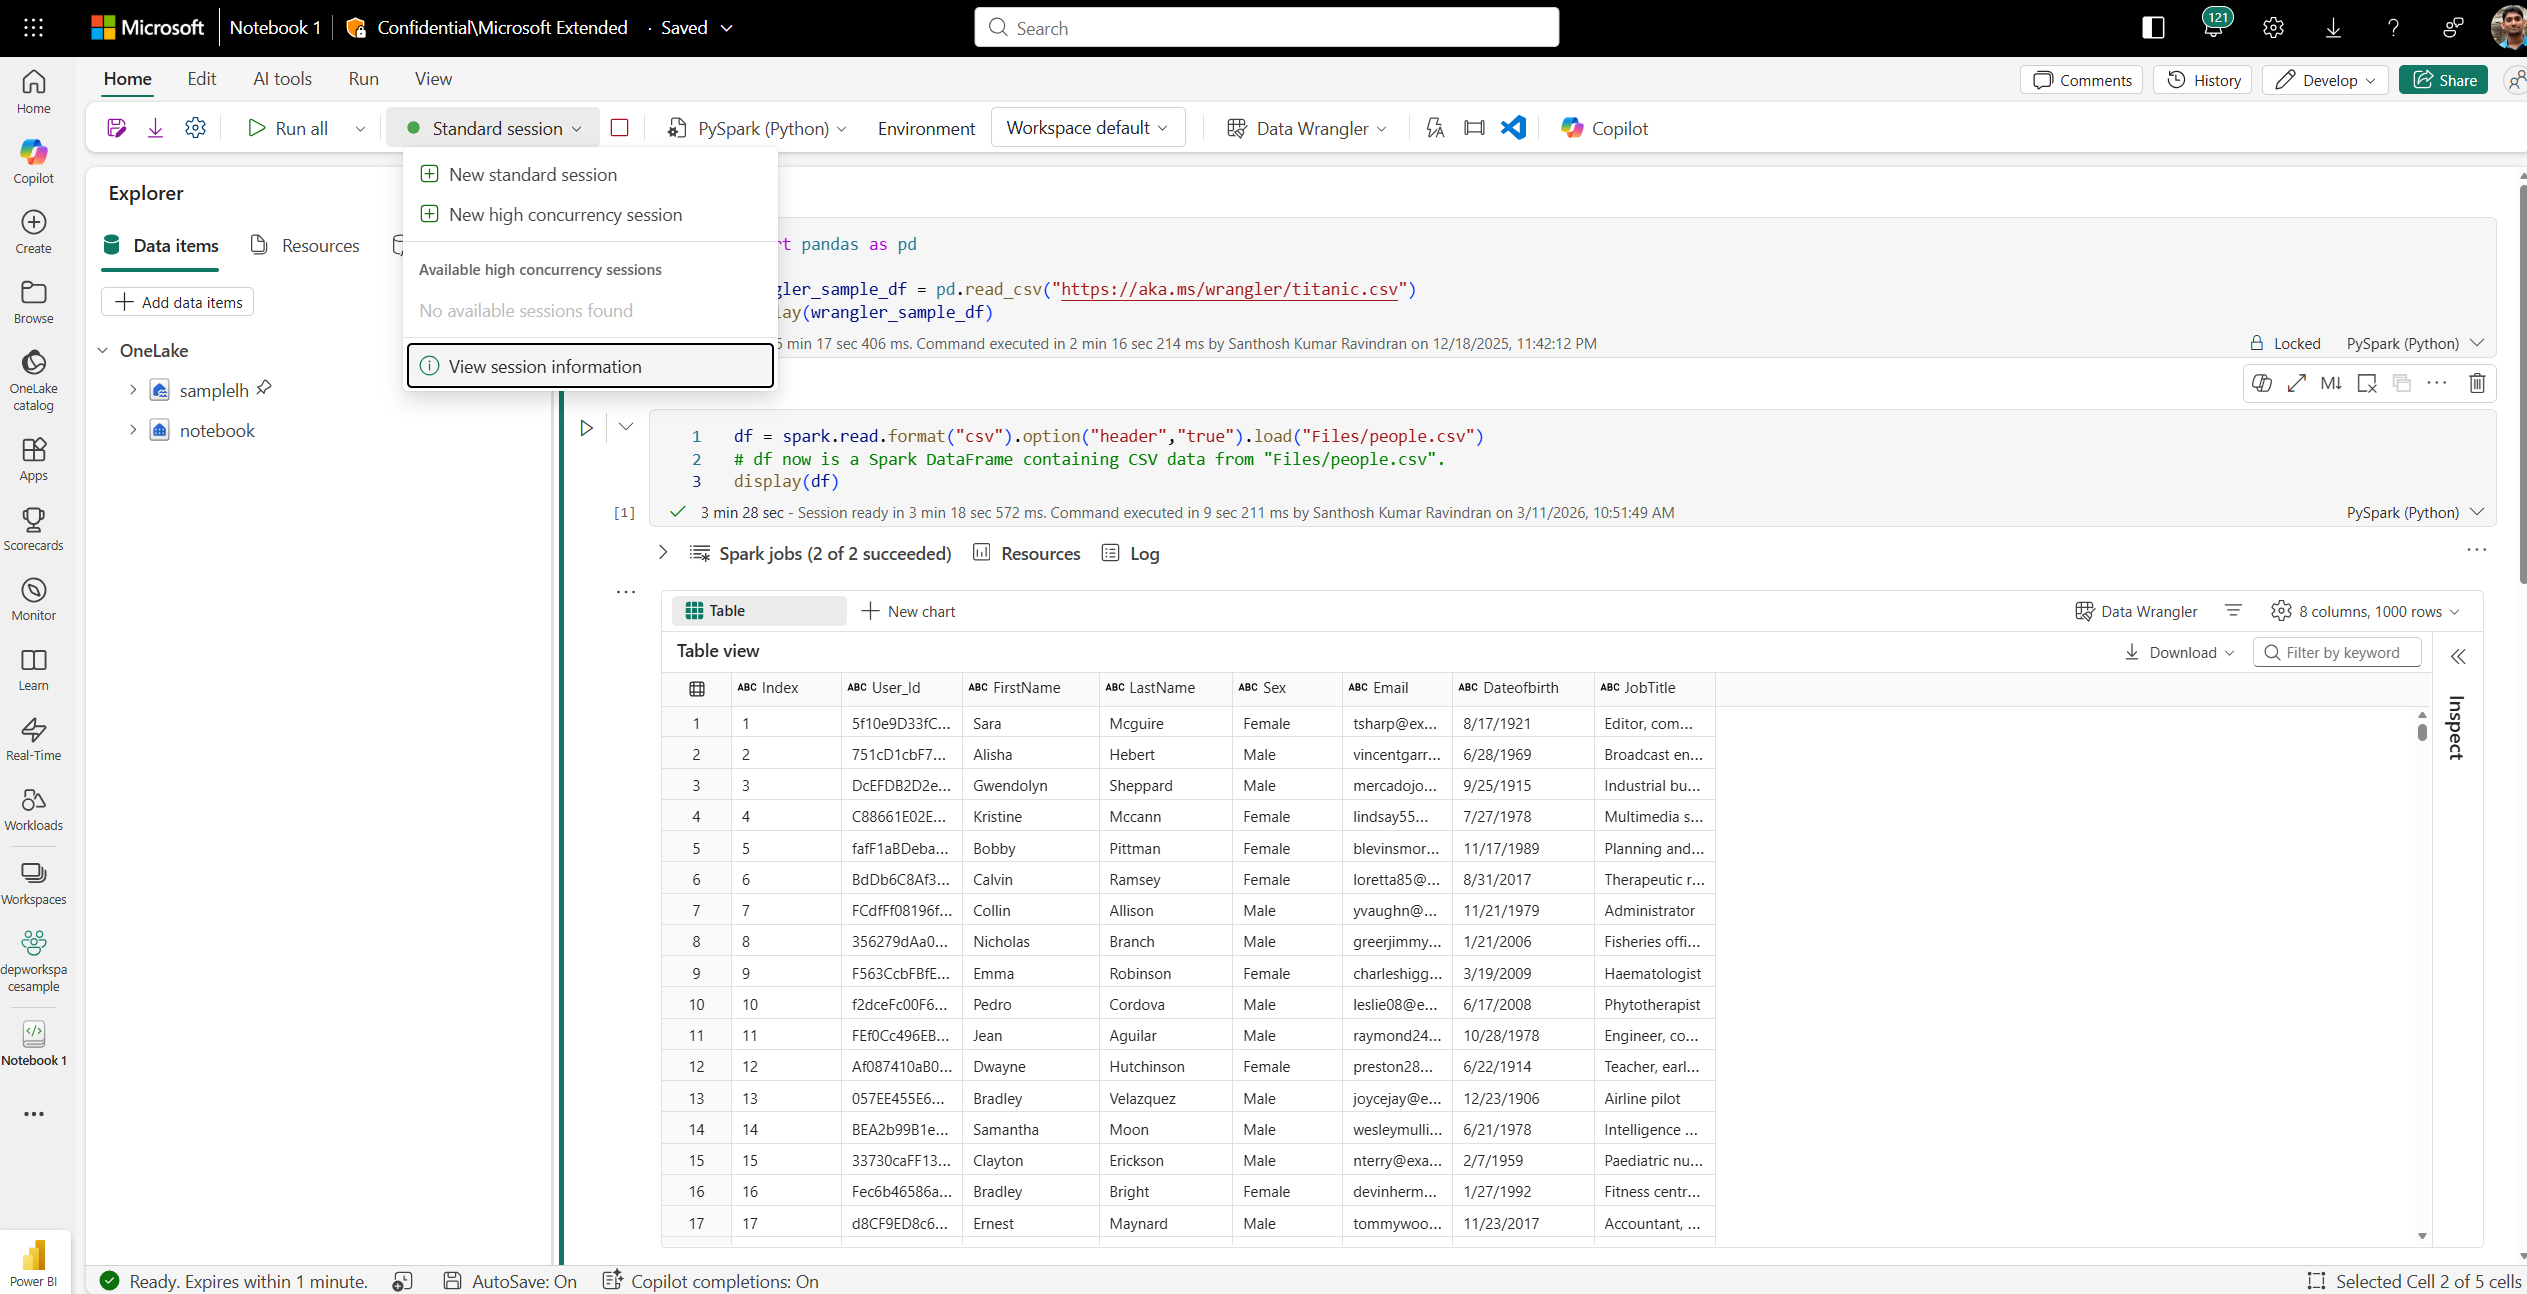
Figure: Notebook with Session Details option
- Review the delay reason and session source (Starter Pool vs. on‑demand)
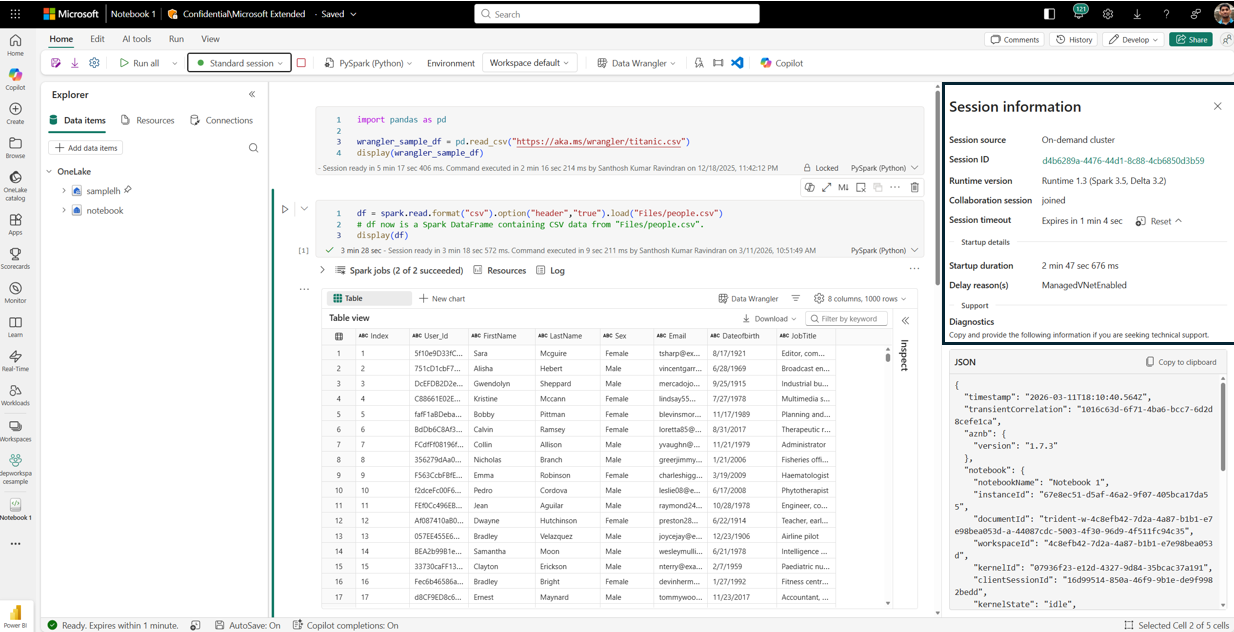
Figure: Notebook with Session Details pane showing session start details
This makes it immediately clear whether the delay was:
- Expected due to configuration choices
- Related to libraries or networking
Learn more about session start insights in the Microsoft Learn documentation.
Z-order and liquid clustering support in the Native Execution Engine
With the Native Execution Engine, Fabric Data Engineering continues to raise the bar on price‑performance leadership for large‑scale analytics. Beyond execution‑time optimizations, the engine now includes native support for Z‑Order and Liquid Clustering, allowing advanced data layout techniques to fully benefit from vectorized, C++‑based execution paths.
This ensures that storage‑level optimizations and execution‑level acceleration work together, delivering compounding performance gains for real‑world analytical workloads.
Why this matters
Modern analytical queries frequently:
- Filter on multiple high‑cardinality columns.
- Scan large Delta tables repeatedly.
- Rely on selective predicates to narrow down results.
Without intelligent data layout, even a highly optimized execution engine can spend unnecessary time scanning data. By combining the Native Execution Engine with Z‑Order and Liquid Clustering, Fabric ensures that:
- Related data is co located on disk, enabling aggressive file and row‑group skipping.
- Queries scan fewer files and fewer bytes.
- CPU‑efficient native operators are paired with I/O‑efficient data access.
On a one‑billion‑row dataset, internal benchmarks comparing fallback execution versus Native Execution Engine with clustering showed:
- 20–32 seconds absolute runtime reduction per query.
- Roughly 20%–27% improvement across multiple clustered column combinations.
- Performance gains observed consistently across different predicate shapes and data distributions.
This brings a compounding performance effect: faster scans, fewer CPU cycles, and lower cost per query, without requiring users to rewrite Spark code or change query semantics. This helps deliver strong price-performance for analytics workloads.
How users enable and use this
1. Enable the Native Execution Engine
Users must first ensure that the Native Execution Engine is enabled for their Spark workloads (at the workspace, environment, or session level). Once enabled, supported Delta operations automatically run through native execution paths.2. Use Z‑Order or Liquid Clustering on Delta tables
Users can apply clustering using standard Delta Lake commands:- Define Liquid Clustering at table creation or apply it to existing unpartitioned tables
- Use OPTIMIZE … ZORDER BY for multi‑column access patterns
To learn more about the Z-Order and Liquid Clustering support or Native engine, refer to the Microsoft Learn documentation.
Copilot for data engineering and data science
Microsoft Fabric notebooks now include a context-aware Copilot experience designed to support you across the full notebook lifecycle. By automatically understanding your workspace environment—including attached Lakehouses, notebook structure, and runtime behavior—Copilot provides assistance that stays aligned with how your notebook is built and executed.
It’s easy to get started with no session startup required. Choose the Copilot icon on the toolbar to open the chat panel. Copilot can help accelerate notebook development by generating and refining code, explaining unfamiliar logic, and assisting with larger notebook workflows. For more complex tasks, Copilot can first propose a plan and then help implement it across the notebook, allowing you to move from idea to working solution more quickly.
Copilot also improves the troubleshooting experience when notebook executions fail. Instead of navigating long stack traces or ambiguous error messages, you can use Copilot to analyze failures, identify likely root causes, and review suggested fixes directly within the notebook.
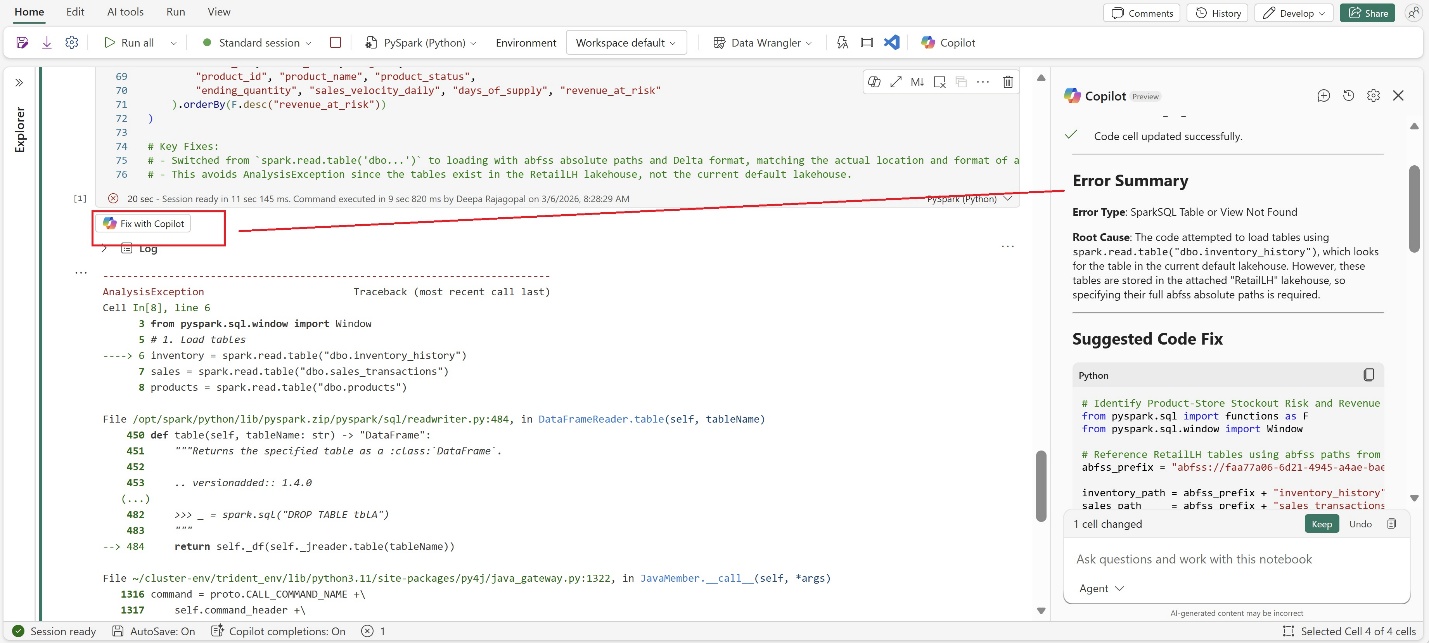
Figure: Fix with Copilot provides error summary and suggested fixes
Throughout this process, built-in guardrails ensure you remain in control. Copilot suggestions are transparent, and proposed code changes can be reviewed before being applied.
Together, these capabilities help teams reduce development friction, resolve issues faster, and build more reliable data workflows.
Try the new Copilot experience today. To learn more, visit the Copilot for Data Engineering and Data Science documentation.
Fabric notebook custom agent inside VS Code
The Fabric notebook custom agent is a Fabric-native AI development agent embedded in the Fabric Data Engineering VS Code extension. It helps data engineers build, debug, and publish Microsoft Fabric notebooks and Spark workloads. Unlike generic coding assistants, this agent operates with full awareness of the Microsoft Fabric workspace, runtime, environments, and Lakehouse resources. It ensures every action—code generation, execution, artifact management, and publishing—is context-aware, validated, and safe for enterprise environments.
Prior to the introduction of the Fabric Notebook custom agent within the VS Code extension, there were notable limitations in how language models understood and interacted with the Microsoft Fabric environment.
For instance, when users provided a prompt such as “read the parquet file from the current default Lakehouse and save it to a delta table,” the language model was unable to interpret what was meant by “default Lakehouse.” As a result, it would generate standard Spark code without leveraging the built-in spark variable available within the notebook, which is essential for initializing and managing Spark sessions in the Fabric environment. With this new agent, the following code will be generated and ready to run.
# Read parquet file from default lakehouse
df = spark.read.parquet(“Files/green_tripdata_2022-08.parquet”)
# Write to delta table in dbo schema
df.write.mode(“overwrite”).format(“delta”).saveAsTable(“dbo.raw_green_tripdata_202208”)
This custom agent should be automatically activated once the Notebook is open.
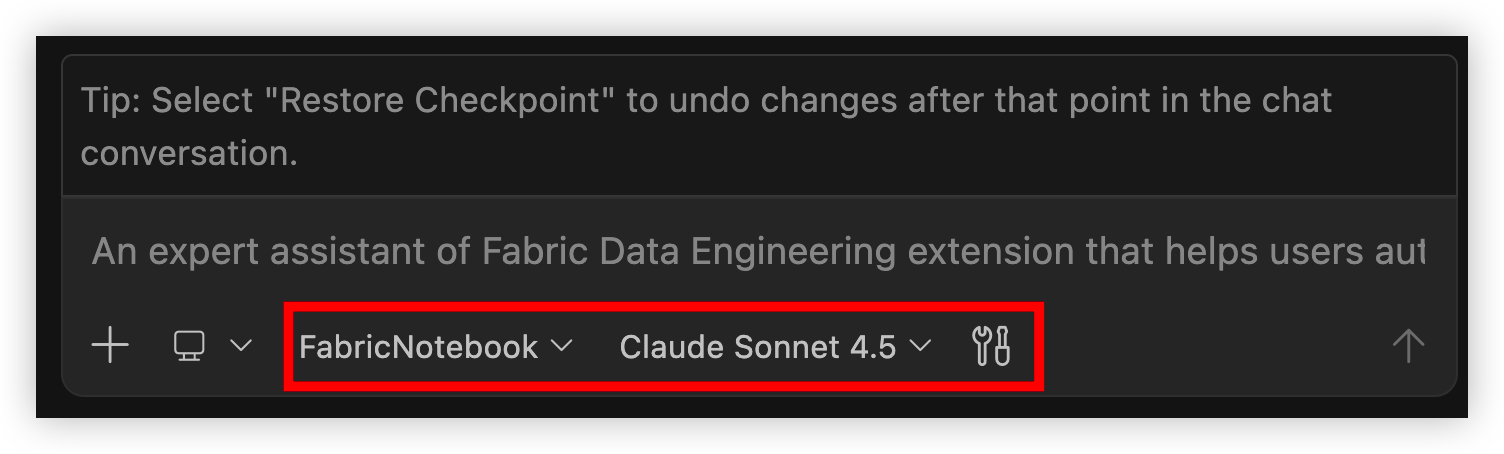
Figure: Fabric notebook custom agent
For more detail, refer to the Author notebook inside VS Code documentation.
Tenant switching inside Fabric Data Engineering VS Code extension
ISV and partners often collaborate with multiple end customers, each typically operating within their own dedicated Microsoft Fabric tenant. To address this need for flexibility, the Fabric Data Engineering VS Code extension now enables tenant switching. With this enhancement, ISVs and partners can easily transition between different customer projects within the same VS Code window, eliminating the need for repeated sign-in processes. This streamlined experience simplifies managing multiple projects and improves overall productivity for professionals working across diverse customer environments.
To switch to a different tenant, select the currently signed-in Fabric user in the status bar and pick the target tenant from the list.
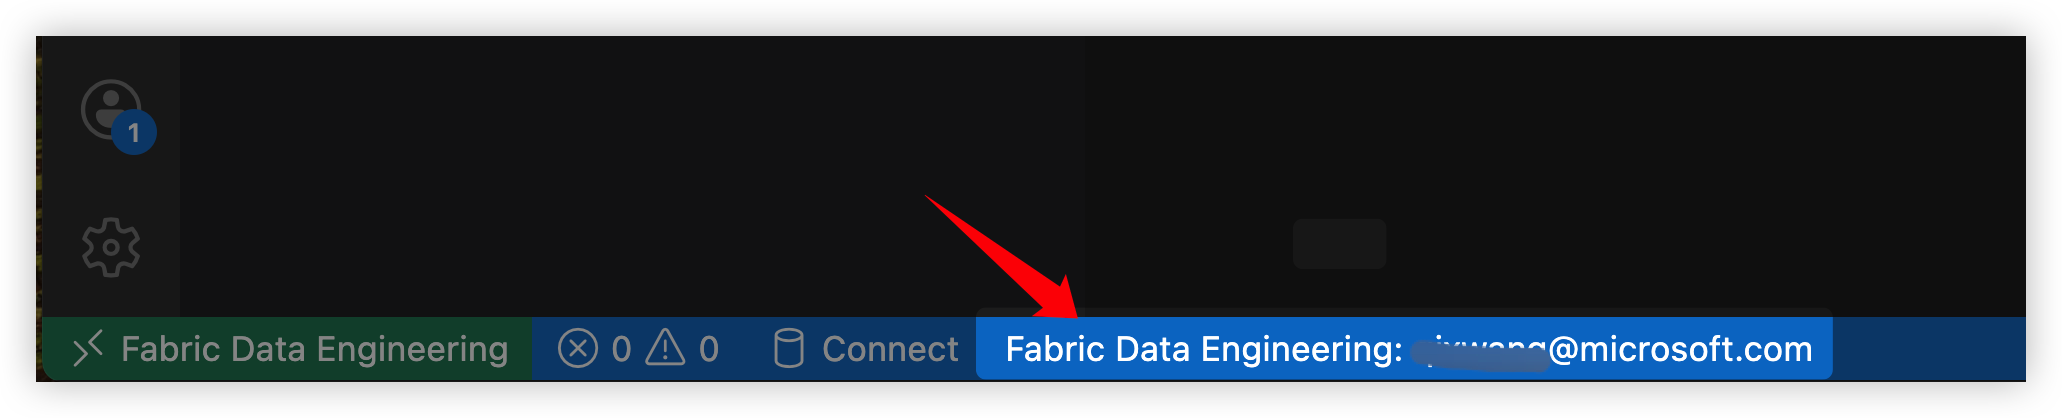
Figure: Switch Fabric tenant inside VS Code
Enable new kernels inside Fabric Data Engineering VS Code extension
Users can now run Fabric notebooks within VS Code using a variety of new kernels. Previously, running notebooks required users to specify the language of each cell using cell magic commands and rely on PySpark as the execution environment. With this enhancement, three additional kernels have been introduced, allowing users to select their preferred programming language directly at the kernel level. This eliminates the need for cell magic commands and streamlines the process, enabling notebooks to be executed in Python, Scala, or Spark SQL natively within VS Code.
Choose Microsoft Fabric Runtime from the top-level kernel list. The available languages then appear in the second panel.
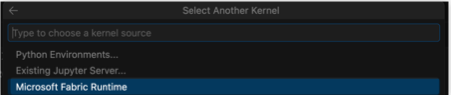
Figure: Microsoft Fabric Runtime entry
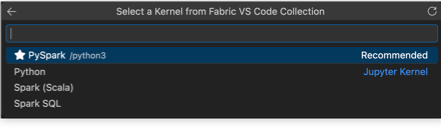
Figure: Supported Fabric notebook languages in VS Code
For more detail, please refer to the documentation Author notebook inside VS Code.
Support for multiple schedules in Fabric materialized lake views
MLVs now support multiple named schedules per lakehouse. Previously, all MLVs shared a single schedule, and teams needing different refresh timings resorted to notebook-triggered refreshes. This workaround bypasses dependency management, centralized error reporting, and retry logic; failures can persist for weeks undetected. Each named schedule now targets a specific subset of views. A finance pipeline can refresh hourly while an analytics pipeline runs every six hours, with no scripting required. When a schedule fires, Fabric refreshes upstream dependencies in order, runs independent views in parallel, surfaces errors centrally, and skips overlapping runs.
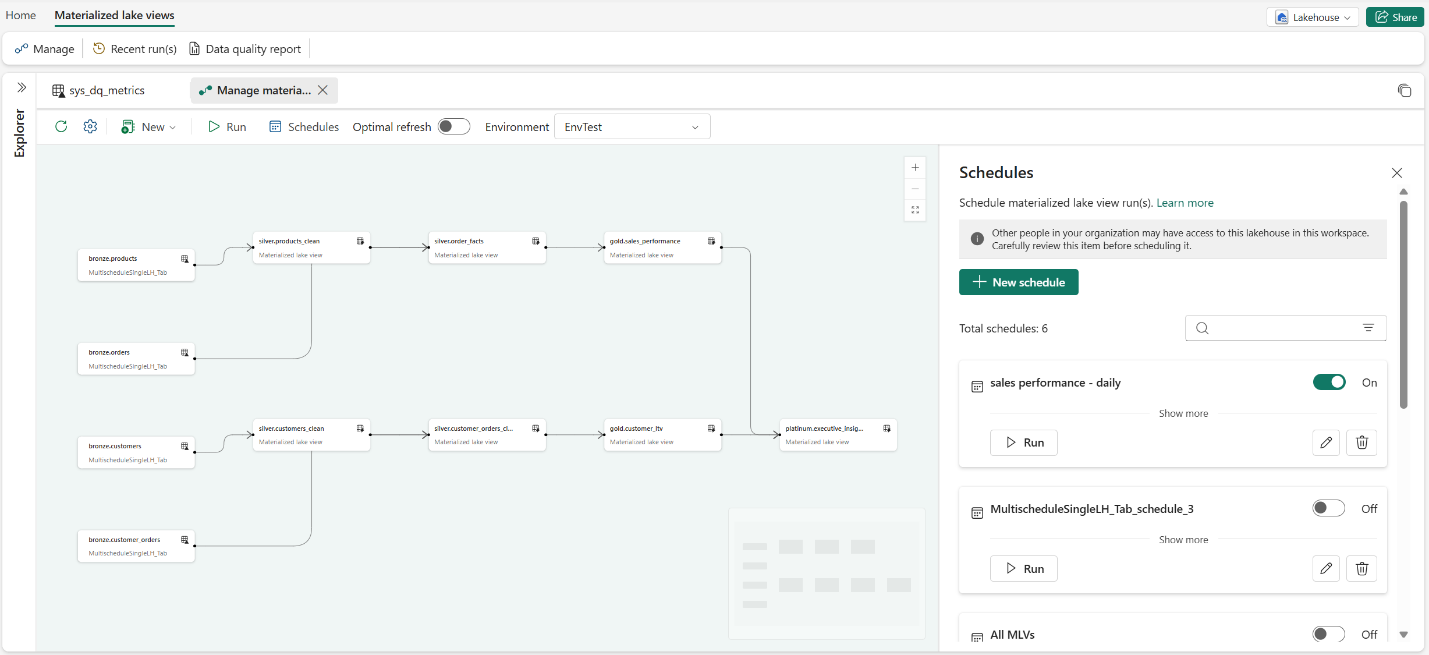
Figure: Schedules panel for materialized lake views, showing configured schedules and available actions
For more information, refer to the Schedule a materialized lake view run documentation.
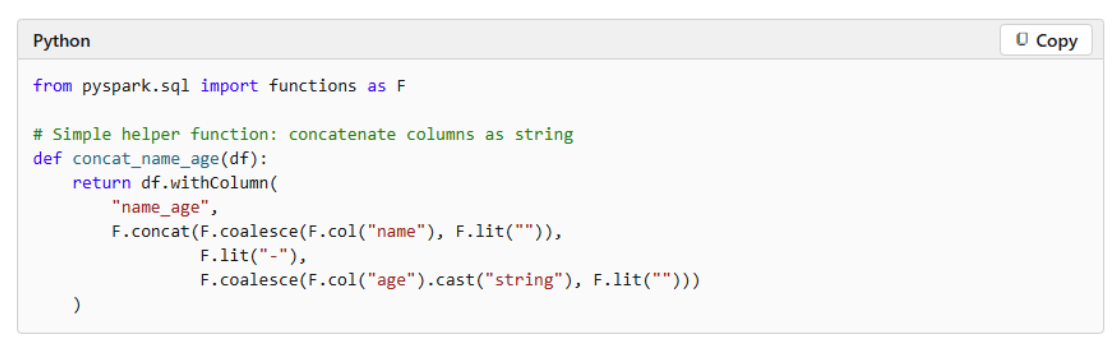
PySpark support for Fabric materialized lake views (Preview)
MLVs now support PySpark authoring (Preview), letting data engineers create, refresh, and replace MLVs from Fabric notebooks using the DataFrameWriter API. Previously, teams wrote definitions in Spark SQL, which made custom cleansing logic, UDFs for business rules, and procedural transformations harder to express. With PySpark authoring, MLVs gain access to the entire Python ecosystem.
A gold-layer MLV can score transactions against a fraud detection model, standardize addresses using a geocoding library, or validate records against external regulatory rules. All existing MLV capabilities, including data quality constraints, table properties, and scheduled refreshes, work identically with PySpark-authored definitions. Full refresh only today; optimal refresh is coming soon.
For more information, refer to the PySpark reference for materialized lake views (Preview) documentation.
Move data from source to Lakehouse in a few moves using Copy job
Getting data into your Lakehouse should be straightforward. For many customers, the first interaction with Microsoft Fabric begins right after creating a Lakehouse and selecting Get data. With this update, Copy job appears at the top of the Get data experience in Lakehouse, making it a more discoverable way to bring data into Fabric.
Whether you’re onboarding your first dataset or scaling ingestion across multiple sources, Copy job can help you move data with minimal setup so you can focus on insights instead of configuration.
Fabric notebooks now support lakehouse auto‑binding when used with Git, making notebooks far more portable across environments such as dev, test, and prod. Instead of hard‑binding a notebook to a specific lakehouse, Fabric automatically resolves the correct lakehouse as the notebook moves across Git‑connected workspaces, reducing manual rebinding and environment‑specific fixes.
This feature is opt‑in and must be enabled from the notebook settings page. Once enabled, it applies to all lakehouses referenced in the notebook, including the default and any additional lakehouses. The configuration is stored in a system‑managed notebook-settings .JSON file in the Git repo, which should not be edited manually. Overall, lakehouse auto‑binding helps teams focus on versioning notebook logic while keeping data and environment configuration cleanly separated.
Try it out in just a few steps:
- Create or open a Lakehouse.
- Select the Get data dropdown in the ribbon.
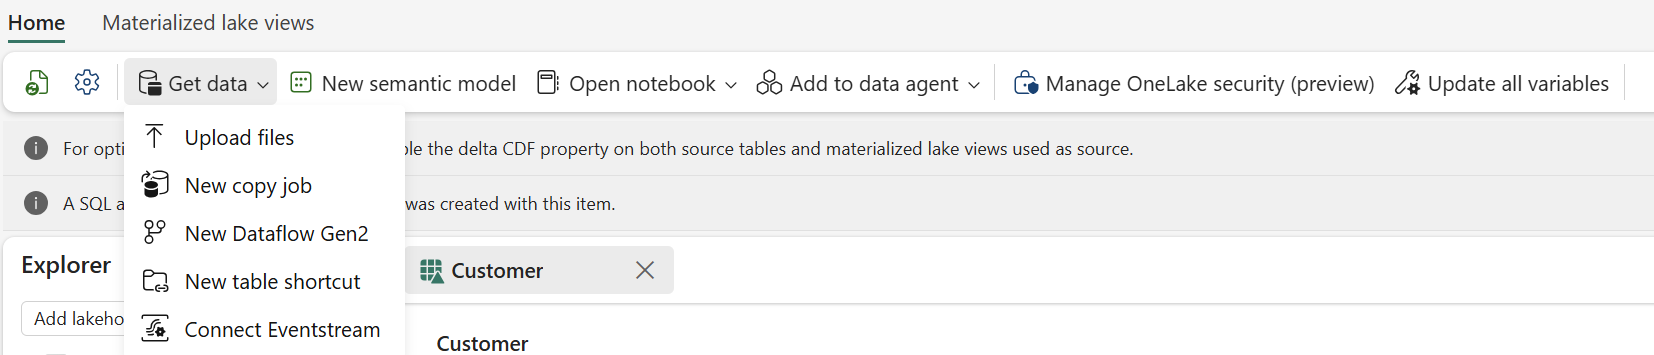
Figure: Start ingesting data into a Lakehouse directly from the Get data dropdown using Copy job
- Select New Copy Job
You’ll be redirected to the Copy Job experience, where you can choose the source data you want to ingest from. In just a few clicks, your data is copied into the Lakehouse and ready for exploration, analysis, and downstream analytics.
Learn more: What is Copy Job in Data Factory – Microsoft Fabric
Notebook supports Lakehouses auto-binding in Git
Fabric notebooks now support lakehouse auto-binding when used with Git flow, making notebooks more portable across environments such as dev, test, and prod. Instead of hard-binding a notebook to a specific lakehouse in the original workspace, auto-binding lets the notebook automatically resolve the linked lakehouse as it moves across Git-connected workspaces. This reduces manual rebinding and environment-specific fixes. This feature is opt‑in and must be enabled from the notebook settings page. Once enabled, it applies to all lakehouses referenced in the notebook, including the default and any additional lakehouses.
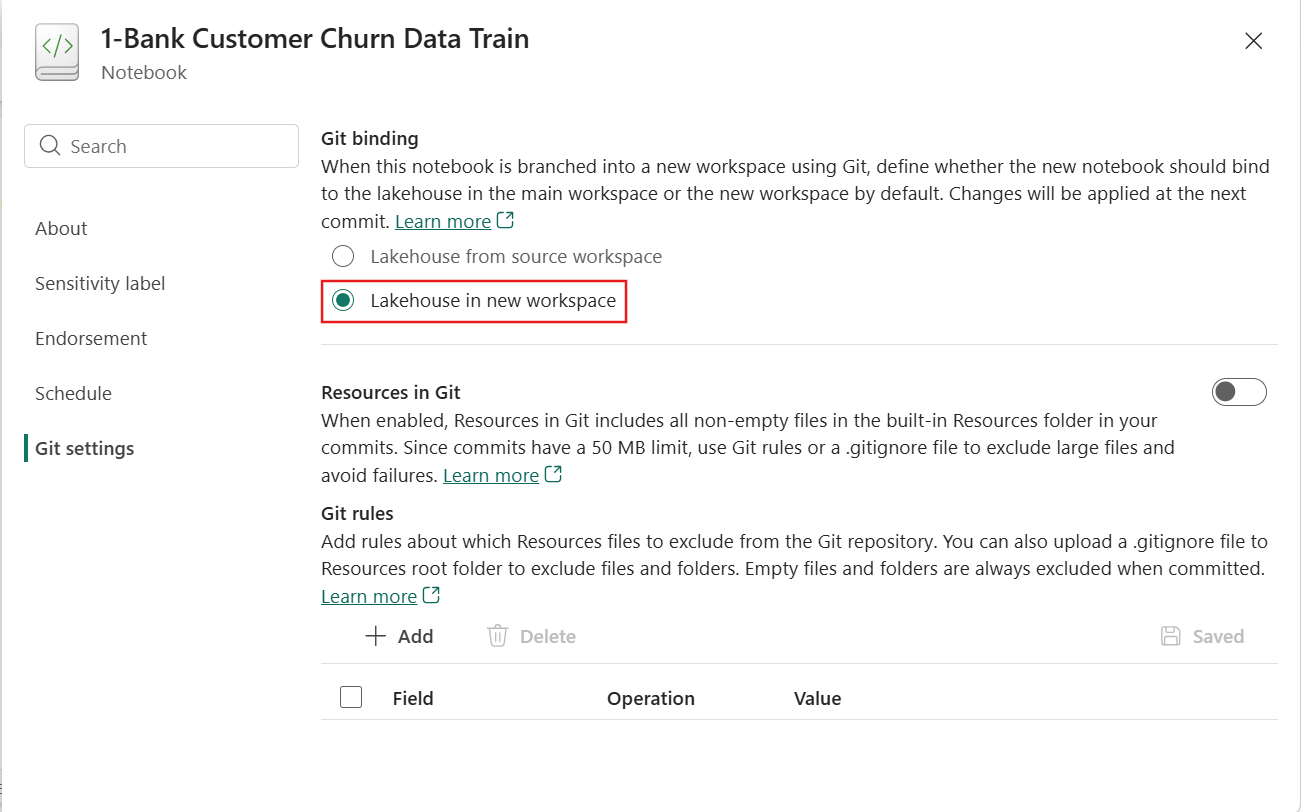
Figure: Entry of auto-binding setting in notebook
The configuration is stored in a system‑managed ‘notebook-settings .json’ file in the Git repo.
Overall, lakehouse auto‑binding helps teams focus on versioning notebook logic while keeping data and environment configuration cleanly managed.
Notebook Resources Folder Support in Git
Notebook projects often depend on more than just notebook code—such as reusable Python modules, configuration files, or small supporting assets. Fabric notebooks now support committing the built‑in Resources folder to Git, enabling true end‑to‑end source control for notebook‑based projects. These resources are versioned alongside the notebook and automatically restored during Git sync.
To support real‑world workflows, this feature includes fine‑grained controls. Teams can define Git exclusion rules or use standard .gitignore files inside the Resources built in folder to avoid tracking large files, temporary assets, generated outputs, or test data.
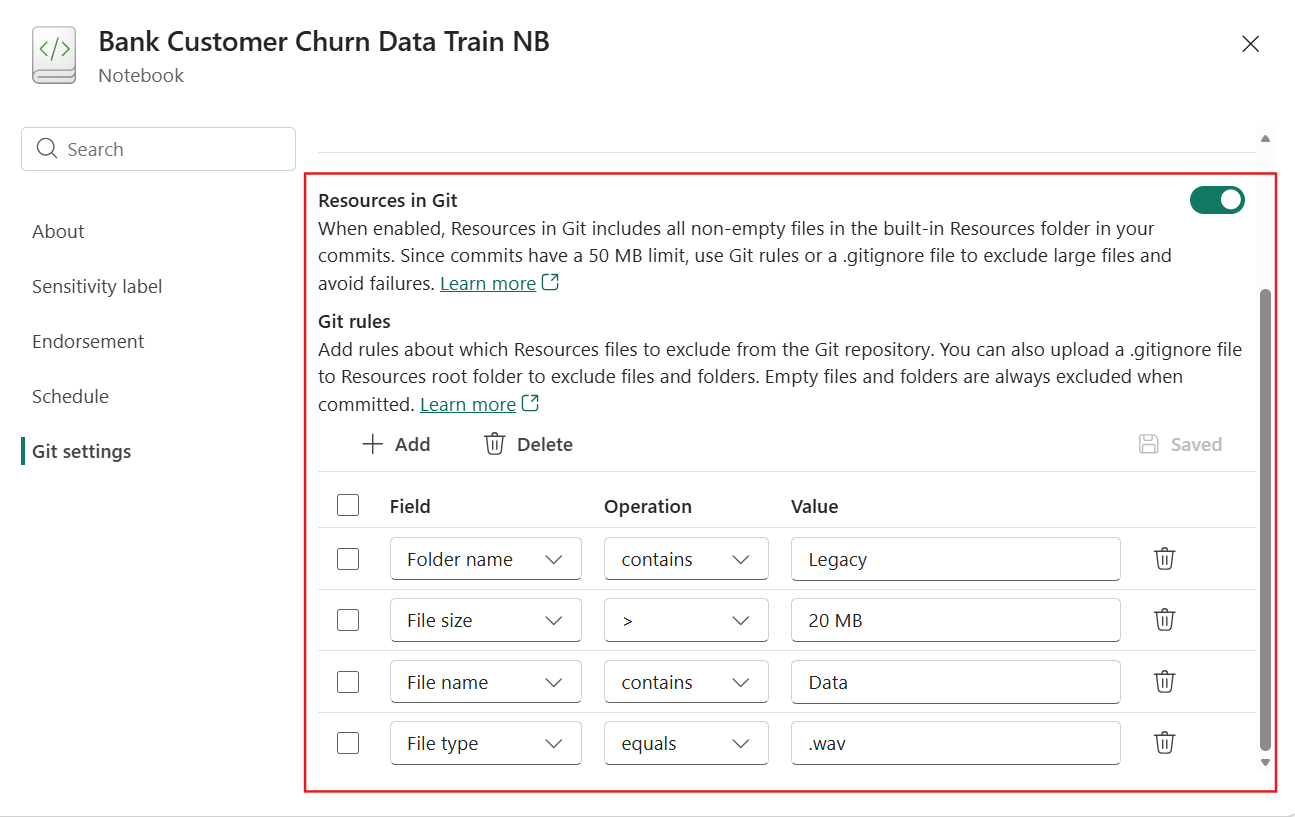
Figure: Define resources in git settings in notebook
The feature is disabled by default to ensure safe adoption and does not introduce noticeable performance impact during commit or sync. The support for Environment resources folder, deployment pipelines, and public APIs is coming soon.
Learn more: Notebook source control and deployment – Microsoft Fabric
Fabric notebook public APIs (Generally Available)
Fabric Notebook Public APIs enable notebooks to be managed and executed programmatically as first‑class assets. The APIs provide full CRUD support—enabling teams to create, update, list, and delete notebooks at scale—making them ideal for CI/CD and automated environment management.
In addition, notebooks can be executed on demand via the Job Scheduler API. You can parameterize notebook runs, customize session configuration, specify environments and lakehouses, monitor execution status, and cancel runs if needed. Secure service principal authentication is also supported. A key enhancement is the ability for notebook runs to return exit values, enabling conditional branching and richer orchestration in pipelines. Together, these APIs unlock seamless integration with Fabric pipelines, external schedulers, and enterprise automation platforms.
Learn more: Items – REST API (Core) and Job Scheduler – REST API (Core).
Improved Copilot completion for Fabric notebooks
We’re introducing upgraded Copilot completion in Fabric notebooks to deliver a faster, more accurate, and more intuitive coding experience. With this update, auto-completion is closer to what developers expect from VS Code‑style inline suggestions, helping you stay in flow while writing notebook code.You can enable the feature from the Copilot completion button in the notebook status bar. It supports both Python and PySpark notebooks.
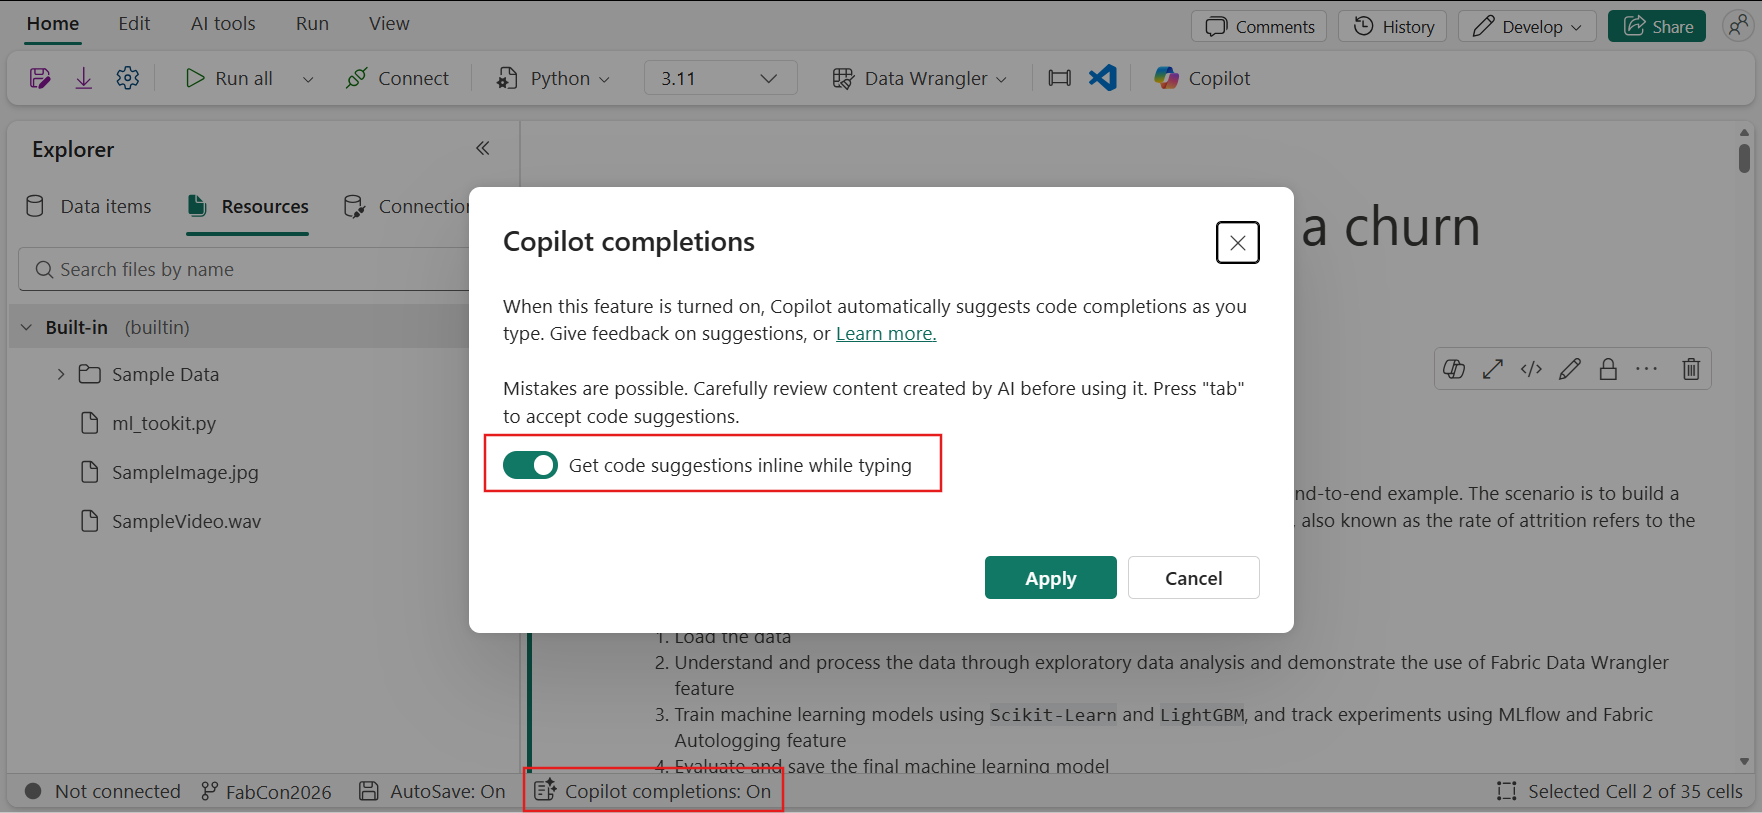 Figure: How to enable copilot completion
A More Natural, Inline Coding Experience
The upgraded auto‑completion is designed to work inline as you type, offering context‑aware code suggestions that better match your intent. Whether you’re writing Python logic, data transformations, or helper functions, Copilot now provides suggestions that feel more predictable, relevant, and easy to accept—reducing friction compared to earlier experiences.
Faster and More Responsive
Performance has been a key focus of this upgrade. Auto‑completion now responds more quickly, reducing latency between keystrokes and suggestions. This makes Copilot feel less intrusive and more like a natural extension of the editor, especially during rapid iteration or exploratory development.
Higher‑Quality Suggestions That Fit Notebook Workflows
Beyond speed, the quality of suggestions has improved. Copilot is better at understanding notebook context, including surrounding cells and in‑progress code, resulting in completions that require less manual editing. The goal is simple: help you write correct, readable code with fewer interruptions and less back‑and‑forth.
Designed for Everyday Notebook Development
This upgraded auto‑completion brings Fabric notebooks closer to the editing experience developers are already familiar with, while remaining optimized for data engineering and analytics workflows.
Learn more by exploring Develop, execute, and manage notebooks – Microsoft Fabric.
Create files in the notebook resources folder
Fabric notebooks now let you create and manage files directly in the built‑in Resources folder, making it easier to develop and maintain notebook dependencies. You can create and edit Python modules, configuration files, and other lightweight assets alongside your notebook code and use them directly within the notebook.
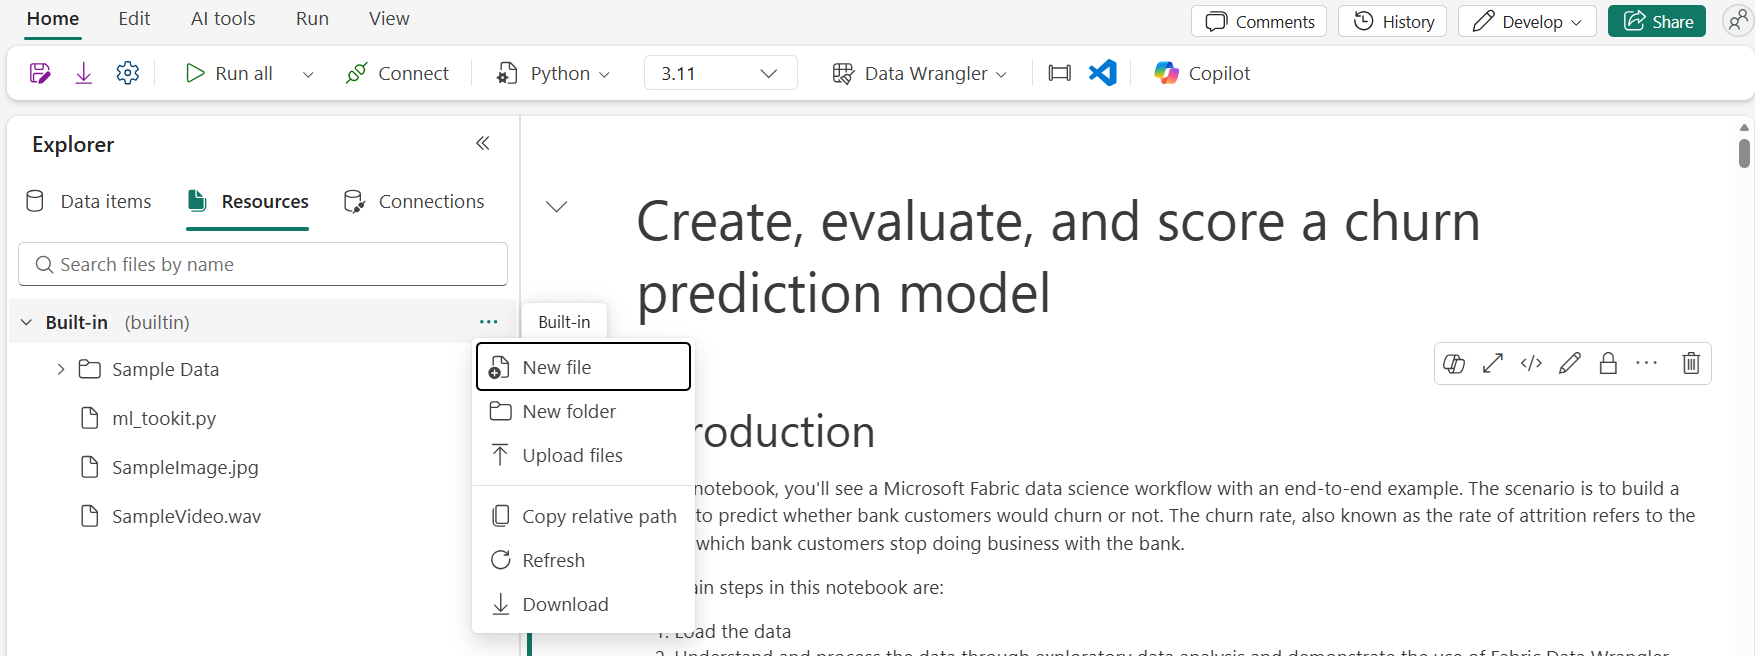
Figure: Entry of creating new file in notebook resources folder
To learn more, refer to How to use notebooks – Microsoft Fabric.
Data Science and AI
Fabric data agents (Generally Available)
- Data sources: Build and consume data agents on a broad set of data sources, including Lakehouse, Warehouse, semantic models, Eventhouse, SQL databases, and mirrored databases.
- Configurations: Configure data agents using agent-level instructions, data source–specific instructions, and example queries to tailor behavior to your scenarios.
- Publish and share: Publishing and sharing data agents within Microsoft Fabric is generally available, making it easier to operationalize and collaborate on data agents.
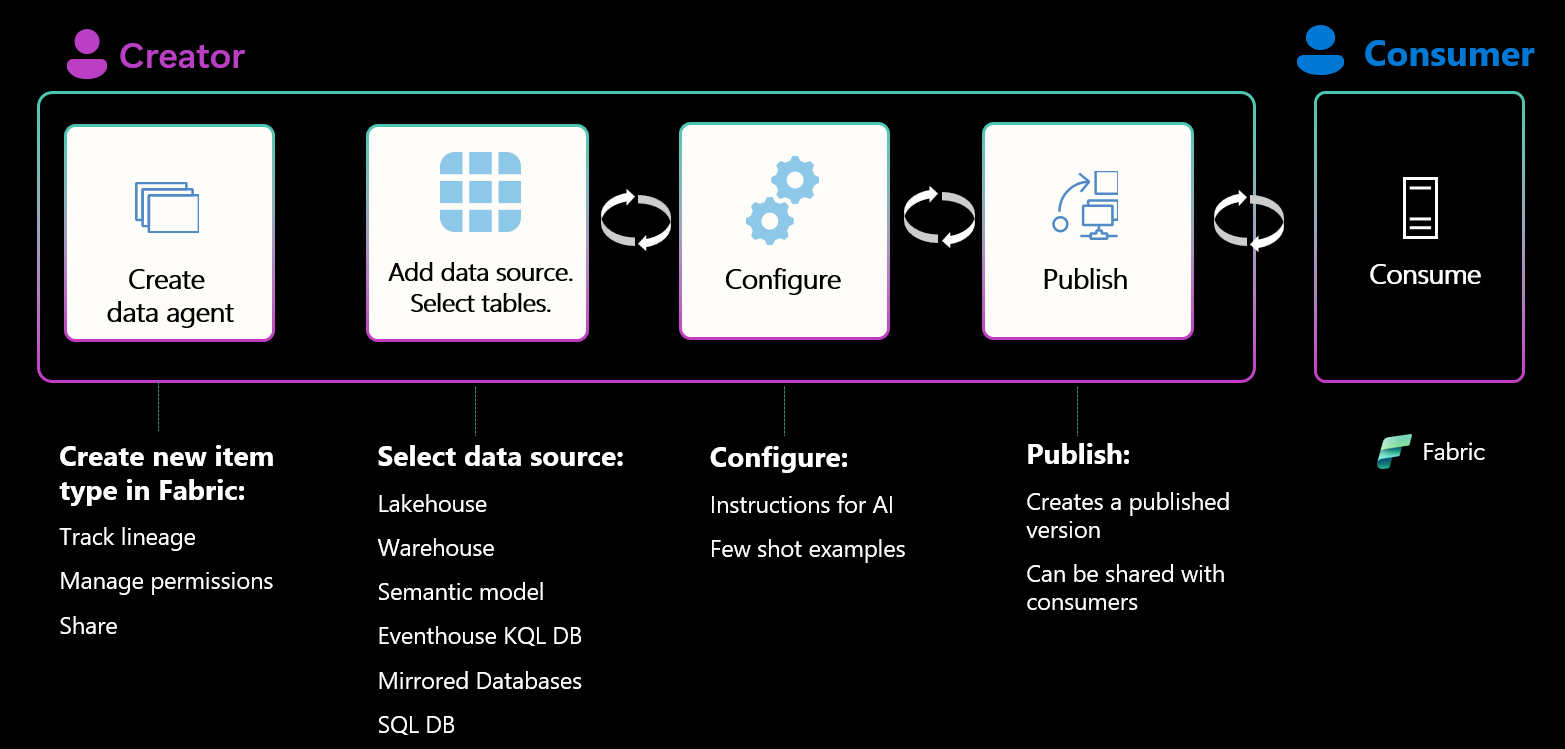
Figure: End-to-end data management workflow from creation through consumption
This release also includes diagnostic, Git integration, and deployment pipelines as part of Microsoft Fabric’s Application Lifecycle Management (ALM) capabilities, enabling troubleshooting and lifecycle management of your agents!
Advanced security and governance in data agents (Preview)
Data agents in Microsoft Fabric (Preview) include capabilities that elevate security and governance standards. Through integration with Microsoft Purview, organizations gain access to comprehensive auditing, eDiscovery, data lifecycle management, communications compliance, and classification. These tools capture prompt and response telemetry along with user context, supporting enterprise protection and regulatory compliance.
Additionally, we are introducing outbound access protection support for the Data Agent artifact to help mitigate sensitive data exfiltration risks and adhere to strict security policies at the individual workspace level.
With these updates, organizations can monitor, control, and safeguard all data agent interactions more effectively.
Data source enhancements for data agents (Preview)
The latest preview brings significant enhancements to data agent source capabilities in Microsoft Fabric. Users can now connect Graph as a data source, enabling them to model and analyze complex relationships within their data for richer, AI-driven insights. Additionally, support for KQL user-defined functions (UDFs) and SQL functions is available, allowing for more sophisticated and efficient querying in KQL- and SQL-enabled sources. These enhancements make data agents more flexible and powerful, supporting faster analytics and expanded scenario coverage.
Insider Risk Management PAYG Usage Report (Generally Available)
Multimodal support for AI functions in Fabric enables notebook users to apply AI capabilities directly to their unstructured data—including PDFs, images, and text files. With just a few lines of code, users can perform tasks such as summarization, classification, sentiment analysis, and more, all within their existing workflows. This capability is designed to work across both pandas and Spark, making it easy to bring AI-driven insights to a wide range of data science and analytics scenarios in Fabric.
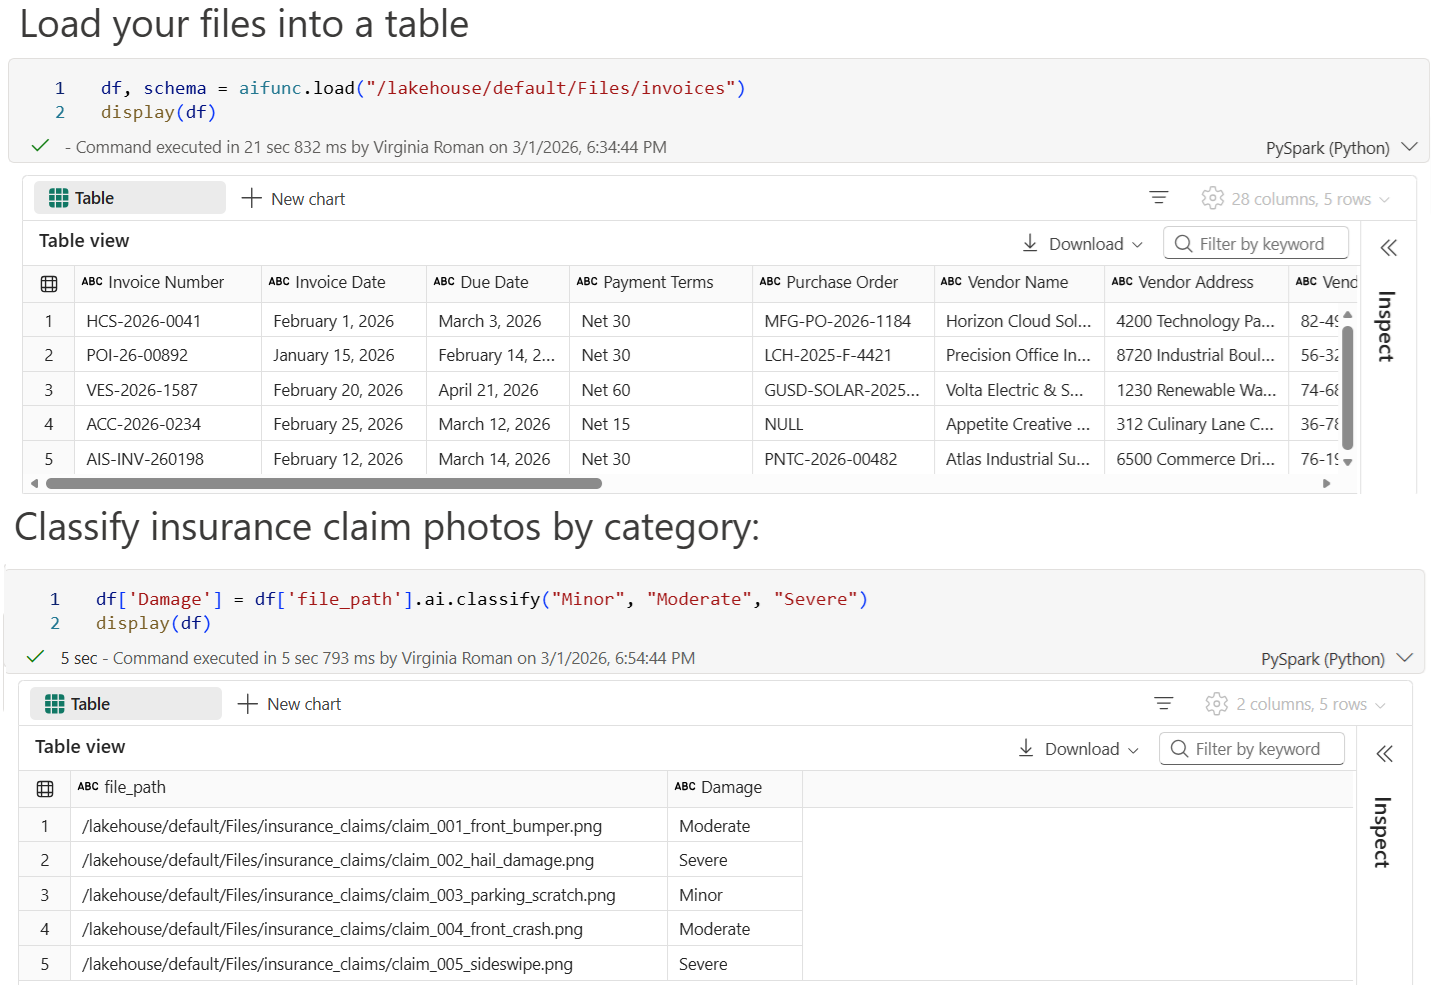
Figure: Load files into a table or classify insurance claim images with multimodal AI functions
Check out the multimodal AI functions documentation to learn more.
AutoML in Fabric (Generally Available)
AutoML delivers a fully production-ready, low-code machine learning experience. In addition to the core AutoML capabilities powered by FLAML—automated model selection, feature engineering, and hyperparameter optimization—the end-to-end UI experience, making it easy to configure experiments, monitor training progress, compare models, and deploy the best performer directly from the interface.
With integrated experiment tracking, reproducibility, and seamless deployment workflows, teams can confidently move from raw data to high-quality predictive models faster—while maintaining transparency, governance, and control within Fabric.
Figure: AutoML includes the fully integrated UI experience for configuring experiments, tracking model performance, and deploying models end to end
Check out the AutoML in Fabric documentation to learn more.
Data Warehouse
Fabric Data Warehouse recovery (Preview)
In fast moving production environments, an item gets dropped accidentally due to an incorrect script. Suddenly, critical reports are broken, and teams are asking the same question: “How fast can we recover?”
With dropped warehouse recovery in Microsoft Fabric, a deleted warehouse no longer means starting over.
You can now restore a dropped warehouse together with everything that goes with it—data, schemas, snapshots, permissions, and saved queries—in minutes, without rebuilds, re‑ingestion, or complex restore workflows.
 Figure: Warehouse recovery in action—from drop to restore in minutes
 There’s no need to recreate environments, rerun pipelines, or scramble through backups. Recovery is simple, predictable, and designed to bring your warehouse back exactly as it was before the drop.
This capability is built for the realities of modern analytics: rapid iteration, frequent deployments, and shared production environments. Instead of turning accidental deletes into prolonged outages, Fabric makes recovery a routine, low-stress operation.
No panic. No need to rebuild. Just built in resilience—designed for real-world production analytics.
To learn more, refer to the manage workspaces documentation.
Alerts and actions
Microsoft Fabric Data Warehouse provides operational intelligence closer to the data by integrating SQL queries with Fabric Activator rules. Traditionally, identifying an issue in query results is only the first step. Teams then need separate systems or manually follow up to notify the right people and act. With this integration, Data Warehouse makes it possible to define rules directly from SQL query outputs, so changes in data can trigger alerts and downstream actions automatically.
This unlocks a simpler way to monitor business-critical conditions using familiar SQL workflows. Teams can create queries that detect scenarios such as SLA risks, failed processes, unusual trends, or threshold breaches, then attach rules that evaluate results continuously and respond in real time. The result is a more proactive analytics experience, where insights move beyond the warehouse and are acted on immediately.
Figure: Create rules on SQL query results to detect data issues, monitor KPIs, and automatically trigger alerts or Fabric workflows.
Analyze unstructured text using T-SQL AI functions (Preview)
Microsoft Fabric Data Warehouse extends modern analytics beyond structured and semi‑structured data by introducing built‑in AI functions for working directly with the unstructured text. Traditionally, processing free‑form content such as notes, logs, or comments requires external services or complex pipelines. With these new capabilities, Fabric Data Warehouse enables text extraction, classification, sentiment analysis, and transformation directly in T‑SQL language, allowing data engineers and analysts to keep AI‑driven text processing inside the warehouse.
The new AI functions simplify common text analytics scenarios using familiar SQL patterns. You can extract structured insights from unstructured text, analyze sentiment in feedback or messages, and classify content such as application logs or incident reports using contextual understanding rather than fragile rules or expressions. Fabric Data Warehouse also supports text transformation scenarios, including summarization, grammar correction, and translation, making it easier to standardize and enrich text data as part of existing data preparation workflows.
The following visual is example of processing unstructured text in the Comments table:
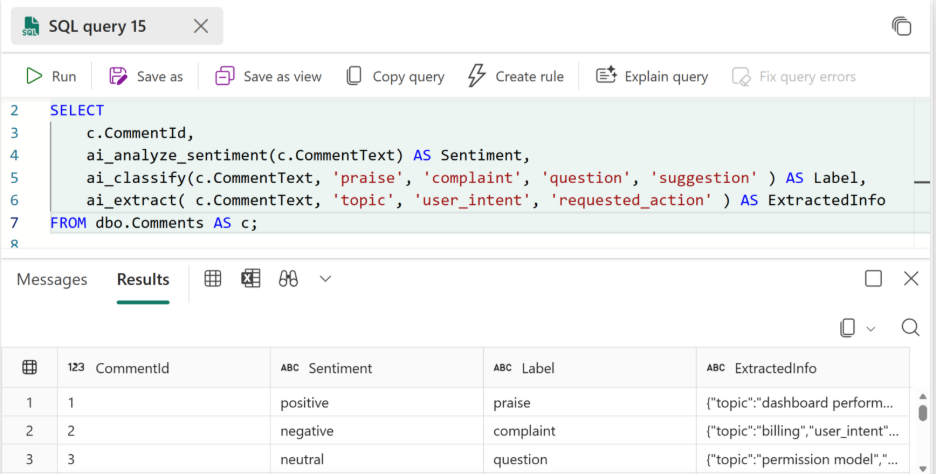
Figure: Analyzing comment text with AI functions
This query enriches each user’s comment by determining its sentiment; labeling the type of feedback or intent; and extracting key discussion signals such as the main topic, user intent, and any requested action using built-in AI functions.
For advanced scenarios, Fabric Data Warehouse enables custom prompt-based processing through a generic ai_generate_response(instructions, text) function. This function allows teams to define precise transformation or extraction rules as prompts; apply domain specific logic; and reuse AI behavior consistently across queries and pipelines. Together, these capabilities significantly broaden the scope of data warehousing scenarios supported in Fabric, unlocking new ways to analyze and operationalize unstructured text using T-SQL.
Refer to AI functions in Fabric Data Warehouse to learn more about analyzing text with built-in AI functions.
ANY_VALUE aggregate
Fabric Data Warehouse provides the ANY_VALUE() aggregate, which lets you return an arbitrary value from each group in T-SQL query. This is especially useful when you need to group results by a key (such as GeographyID) but you still want to project descriptive attributes (such as city name, and country) that are functionally the same for every row in that group. An example of such a query is illustrated in the following picture, demonstrating how ANY_VALUE() aggregate can be used to get the values from the group that are not changing.
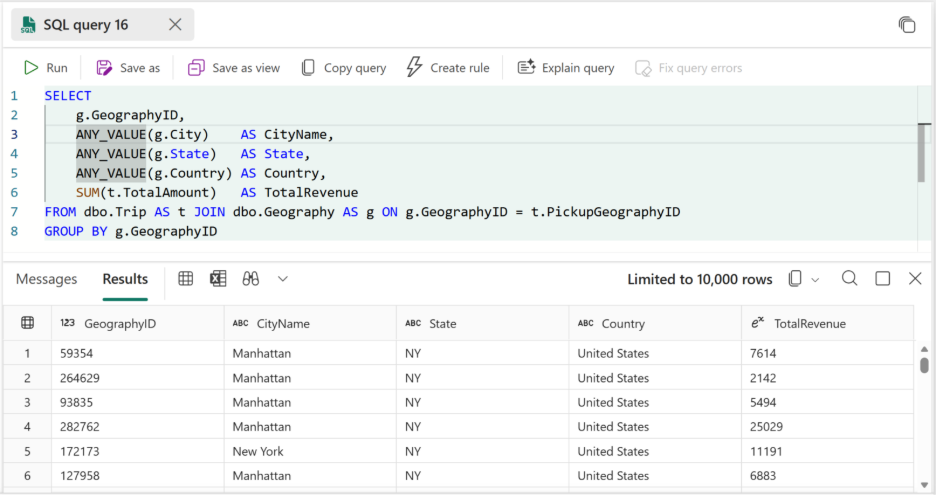
Figure: Using ANY_VALUE() to project descriptive columns while aggregating trips by GeographyID
In this pattern, city, state, and country don’t add meaning to the aggregation because they’re constant for a given GeographyID. Adding these columns in the GROUP BY clause or applying more complex or costly aggregates like MIN or MAX is unnecessary overhead and makes queries harder to read and maintain.
ANY_VALUE keeps the grouping logic minimal and the intent clear: aggregate by the key and simply carry through the descriptive columns.
Refer to the ANY_VALUE function in Fabric Data Warehouse documentation to find additional scenarios where it helps simplify grouping and aggregation logic.
Fabric warehouse custom SQL pools (Preview)
Custom SQL pools for Fabric Data Warehouse gives administrators finer-grained control over how SQL compute resources are allocated across workloads. Custom SQL pools build on the warehouse’s autonomous workload management by letting you define your own isolation boundaries, explicitly assign resources, and route queries based on application context.
With Custom SQL Pools, you can create multiple isolated SQL pools within a single workspace and allocate a percentage of available compute to each. Queries are routed to the appropriate pool ensuring that critical workloads get the resources they need without being impacted by other activities in the warehouse.
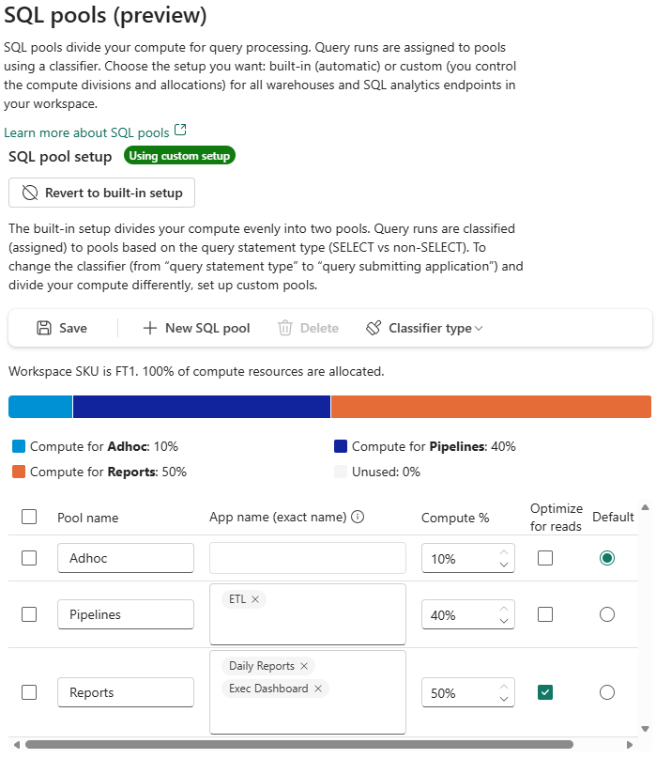
Figure: Custom SQL Pool Configuration
Key benefits include:
- Predictable performance for critical workloads—Reserve compute for business‑critical reporting or dashboards, so they aren’t disrupted by ad‑hoc queries or background processing.
- Flexible workload isolation without added complexity—Allocate resources where they matter most without needing to split workloads across multiple workspaces or scale capacity just to protect one workload.
Custom SQL Pools are especially useful when multiple applications share a single Fabric warehouse or SQL analytics endpoint and have different performance or priority requirements. As your capacity scales up or down, your pool allocations automatically scale with it, preserving the relative resource distribution you’ve defined.
Learn more about custom SQL pools in Fabric Data Warehouse: Custom SQL Pools – Microsoft Fabric | Microsoft Learn.
SQL Audit Logs (Generally Available)
SQL Audit Logs for Fabric Data Warehouse enable organizations to capture and analyze database activity for security monitoring, compliance, and forensic analysis.
Figure: Configuring SQL Audit Logs
With this release, we are expanding support and improving accessibility:
- Support for SQL Analytics Endpoint auditing.
- Direct access to audit files stored in OneLake, through OneLake Explorer.
- Ability to download or copy audit files through OneLake Explorer.
- Ability to open the .xel audit files directly in SQL Server Management Studio (SSMS) for deeper investigation.
These capabilities make it easier for security and compliance teams to perform detailed investigations, long-term retention, and external analysis of workflows.
For configuration steps and usage details, see the documentation:
SQL Audit Logs in Fabric Data Warehouse – Microsoft Fabric | Microsoft LearnCOPY INTO and OPENROWSET support for OneLake sources (Generally Available)
Previously, this capability supported Lakehouse sources only. With this release, we are expanding support to all OneLake items (except Warehouses).
This enables much more flexible ingestion scenarios, including:
- Using partner workloads such as COPY Jobs.
- Using staging areas across different Fabric items.
- Loading data stored anywhere in OneLake-backed items.
Customers can now leverage OneLake as a unified staging layer for ingestion workflows while maintaining a consistent SQL experience.
Figure: Executing COPY INTO from OneLake sources
For full usage examples and configuration guidance, see the documentation:
Ingest Data into Your Warehouse Using the COPY Statement – Microsoft Fabric | Microsoft LearnCOPY INTO (Transact-SQL) – Azure Synapse Analytics and Microsoft Fabric | Microsoft Learn
Outbound Access Protection (OAP) support for Warehouse (Generally Available)
Outbound Access Protection for Fabric Data Warehouse provides stronger data exfiltration protection for enterprise environments.
Warehouse now supports connector rules that allow organizations to control which external sources the warehouse can access.
Customers can define rules to allow access to:
- Specific Azure Data Lake Storage Gen2 accounts
- Other Fabric workspaces
- Approved external connectors
This expands the model introduced during Preview, where access was limited to OneLake and local workspace sources only.
With connector rules, organizations can enforce controlled and auditable outbound connectivity, helping meet strict governance and compliance requirements.
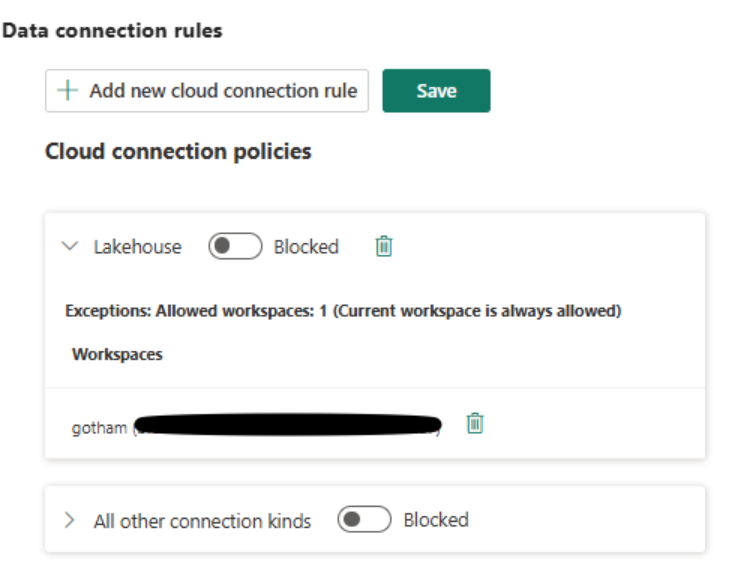
Figure: Supporting OAP Data Connection Polices
For details on configuring connector rules, see the documentation:
Workspace outbound access protection for data warehouse workloads – Microsoft Fabric | Microsoft LearnFull query text available in Query Insights
Query Insights now show the full SQL query text, removing the previous 8,000‑character truncation.
The complete query text is available in:
- The command column of queryinsights.exec_requests_history.
- The Query Details pane in the Query activity tab.
This makes it significantly easier to understand what ran, especially for large, auto‑generated queries from BI tools, ORMs, or complex workloads.
You can now retrieve the full query text directly using:
SELECT
distributed_statement_id,
submit_time,
total_elapsed_time_ms,
command
FROM queryinsights.exec_requests_history
ORDER BY submit_time DESC;
This query takes the most frequently executed query (from Frequently Run Queries) and pulls every historical execution with the full, untruncated SQL text, making it easy to understand exactly what is running and how often:
WITH TopQuery AS (
SELECT TOP 1 query_hash
FROM queryinsights.frequently_run_queries
ORDER BY number_of_runs DESC
)
SELECT
erh.query_hash,
erh.distributed_statement_id,
erh.submit_time,
erh.total_elapsed_time_ms,
erh.status,
erh.allocated_cpu_time_ms,
erh.data_scanned_remote_storage_mb,
erh.command AS full_query_text
FROM queryinsights.exec_requests_history AS erh
JOIN TopQuery AS tq
ON erh.query_hash = tq.query_hash
ORDER BY erh.submit_time DESC;
Because the full statement is preserved, users can:
- Immediately understand what logic was executed, not just which query ran.
- Compare query text across executions to detect subtle changes or regressions.
- Correlate performance issues with specific joins, filters, or aggregations.
This enhancement removes a major gap between observability and action, making Query Insights a more complete tool for day-to-day production troubleshooting.
Live connectivity in Migration Assistant for Fabric Data Warehouse (Preview)
The live connectivity in Migration Assistant for Fabric Data Warehouse lets you migrate object metadata by connecting directly to your source system into a new Fabric warehouse. This helps you accelerate migration and reduce upfront prep by eliminating the need to generate and upload a DACPAC for the metadata step. The object metadata of schemas, tables, views, functions, and stored procedures gets migrated to warehouse.
Figure: Migration using direct connection to the source system
Learn more about Migrate with a Direct Connection.
Simplify data access with data sources (Generally Available)
Fabric Data Warehouse lets you define external data sources that act as named references to locations in your lake (for example, a root folder of a Fabric Lakehouse or an Azure Storage account). External data sources (Preview) were introduced in preview in October 2025, now they are generally available and fully integrated into the Fabric experience, with the full IntelliSense and Copilot support in the SQL query editor.
The following visual shows how to create a reusable reference to the Fabric Lakehouse root folder that represents a landing zone where you can store the files before ingesting them in warehouse:
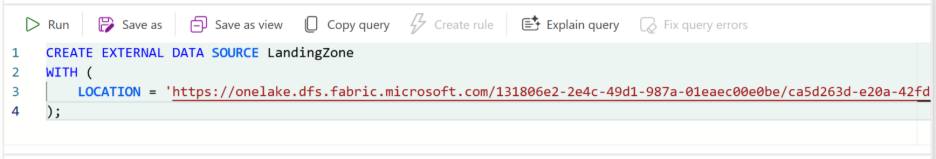
Figure: Creating external data source in Fabric Data Warehouse.
In the following visual, you can see how you can query files using short, relative paths that are resolved against the data source root:
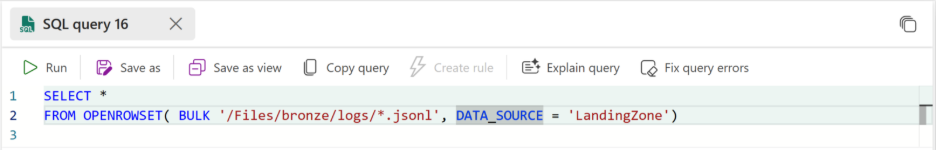
Figure: Accessing files in the referenced data source using the relative path
Using a data source keeps queries clean and portable. You can write easy to remember relative paths (like /Files/bronze/logs/*.jsonl) instead of embedding long, environment-specific URLs everywhere in the code. This makes scripts simpler to maintain and easier to share across workspaces and environments.
Find more examples about the reading files form the lake in OPENROWSET(BULK) (Transact-SQL) documentation page.
Real-Time Intelligence
Business Events in Microsoft Fabric (Preview)
With Business Events, organizations can move from observing what happened to acting on what matters, in real time. It enables organizations to respond faster, operate more intelligently, and scale real-time decision making across analytics, automation, and AI. You can generate business events from user data functions (UDFs) and notebooks. Once generated, a single business event can power multiple downstream actions, such as:
Trigger alerts and automations with Activator, responding immediately via email or Teams.
- Execute custom logic using user data functions, reacting programmatically to business events.
- Run analytics and workflows in notebooks, using events to drive downstream analysis.
- Provide real‑time context with AI and ML, enriching models with governed business signals.
- Integrate with Spark jobs, dataflows, and Power Automate, enabling distributed processing and business process automation.
With Business Events in Real-Time Hub, you can explore, define, and act on critical business signals for the whole organization in a unified experience.
Figure: Business Events creation experience
For more information about this feature, please refer to the documentation: Business Events in Microsoft Fabric.
Building event-driven, real-time applications on database changes with Fabric Eventstreams Deltaflow (Preview)
Building intelligent systems that react quickly to operational database changes is simpler with this update. With the release of DeltaFlow, Fabric Eventstreams can seamlessly capture inserts, updates, and deletes from operational databases, transform them from their raw Debezium format, and make them available to downstream event-driven applications using Activator and for real-time analytics in Eventhouse. There’s no need for custom Debezium/JSON processing code or to explicitly manage destination tables through source table schema changes.
- Easily connect to, ingest from, and transform raw CDC feeds into analytics-ready form.
Figure: Enabling DeltaFlow when connecting to an Azure SQL database
- Detect, fetch and register source database & table schemas in the Eventstream schema registry as they evolve.
Figure: Automatic registration and use of source table schemas
- Automatically manage tables in analytics store as they continuously evolve with source schema changes without breaking pipelines.
Figure: Automatically created Eventhouse tables with analytics-ready shapes
For more information about these features, please refer to the document Building real-time, event-driven applications with Database CDC feeds and Fabric Eventstreams DeltaFlow (Preview).
Real-time stream processing with Fabric Eventstreams and Spark notebooks (Preview)
This update brings together Fabric Eventstreams and Spark Structured Streaming, making it easier for Spark developers and data engineers to work with real-time data in Microsoft Fabric. These enhancements enable you to access streaming data in Eventstreams directly from Spark notebooks, supporting low-latency processing and end-to-end real-time AI pipelines.
- Easily discover Eventstreams and real-time sources available through the Real-Time Hub, right from within Fabric notebooks.
Figure: Real-Time Hub view inside Fabric notebook—discover Eventstreams in seconds
- Connect to and process streaming data within minutes using auto-generated PySpark code snippets.
Figure: Auto-generated PySpark snippet in a Fabric notebook for an Eventstream
- Load and use existing notebooks from the Fabric Eventstreams portal.
Figure: Load a Spark notebook as an Eventstream destination—reuse and collaborate
- Securely connect to any Eventstream from a Fabric Spark job without connection strings and secrets, using the enhanced Spark adapter for Eventstreams.
- Securely connect to any Eventstream from a Fabric Spark notebook using the enhanced Spark adapter—without connection strings or secrets, and with built-in auto-retry support.
For more information about these features, please refer to the blog post Bringing Together the world of Real-time Intelligence and Spark Structured Streaming (Preview).
Anomaly Detector full-item experience
Introducing a refreshed Anomaly Detector full‑item experience that makes it easier to create, run, and explore anomaly detection workflows from end to end. Instead of working through disconnected steps or modal flows, you now get a single, full‑page canvas that brings configuration, analysis, and results together in one place. The updated layout follows Fabric’s shared item experience, so navigation and interactions feel consistent with the rest of the platform.
With this new experience, you can more quickly define detection scenarios, run analyses, and immediately dig into detected anomalies without losing context. Clearer sectioning and action cues guide you through the process—from selecting signals and parameters to reviewing anomaly trends and individual data points. Results stay visible alongside configuration, making it easy to iterate, compare outcomes, and refine your setup in real time.
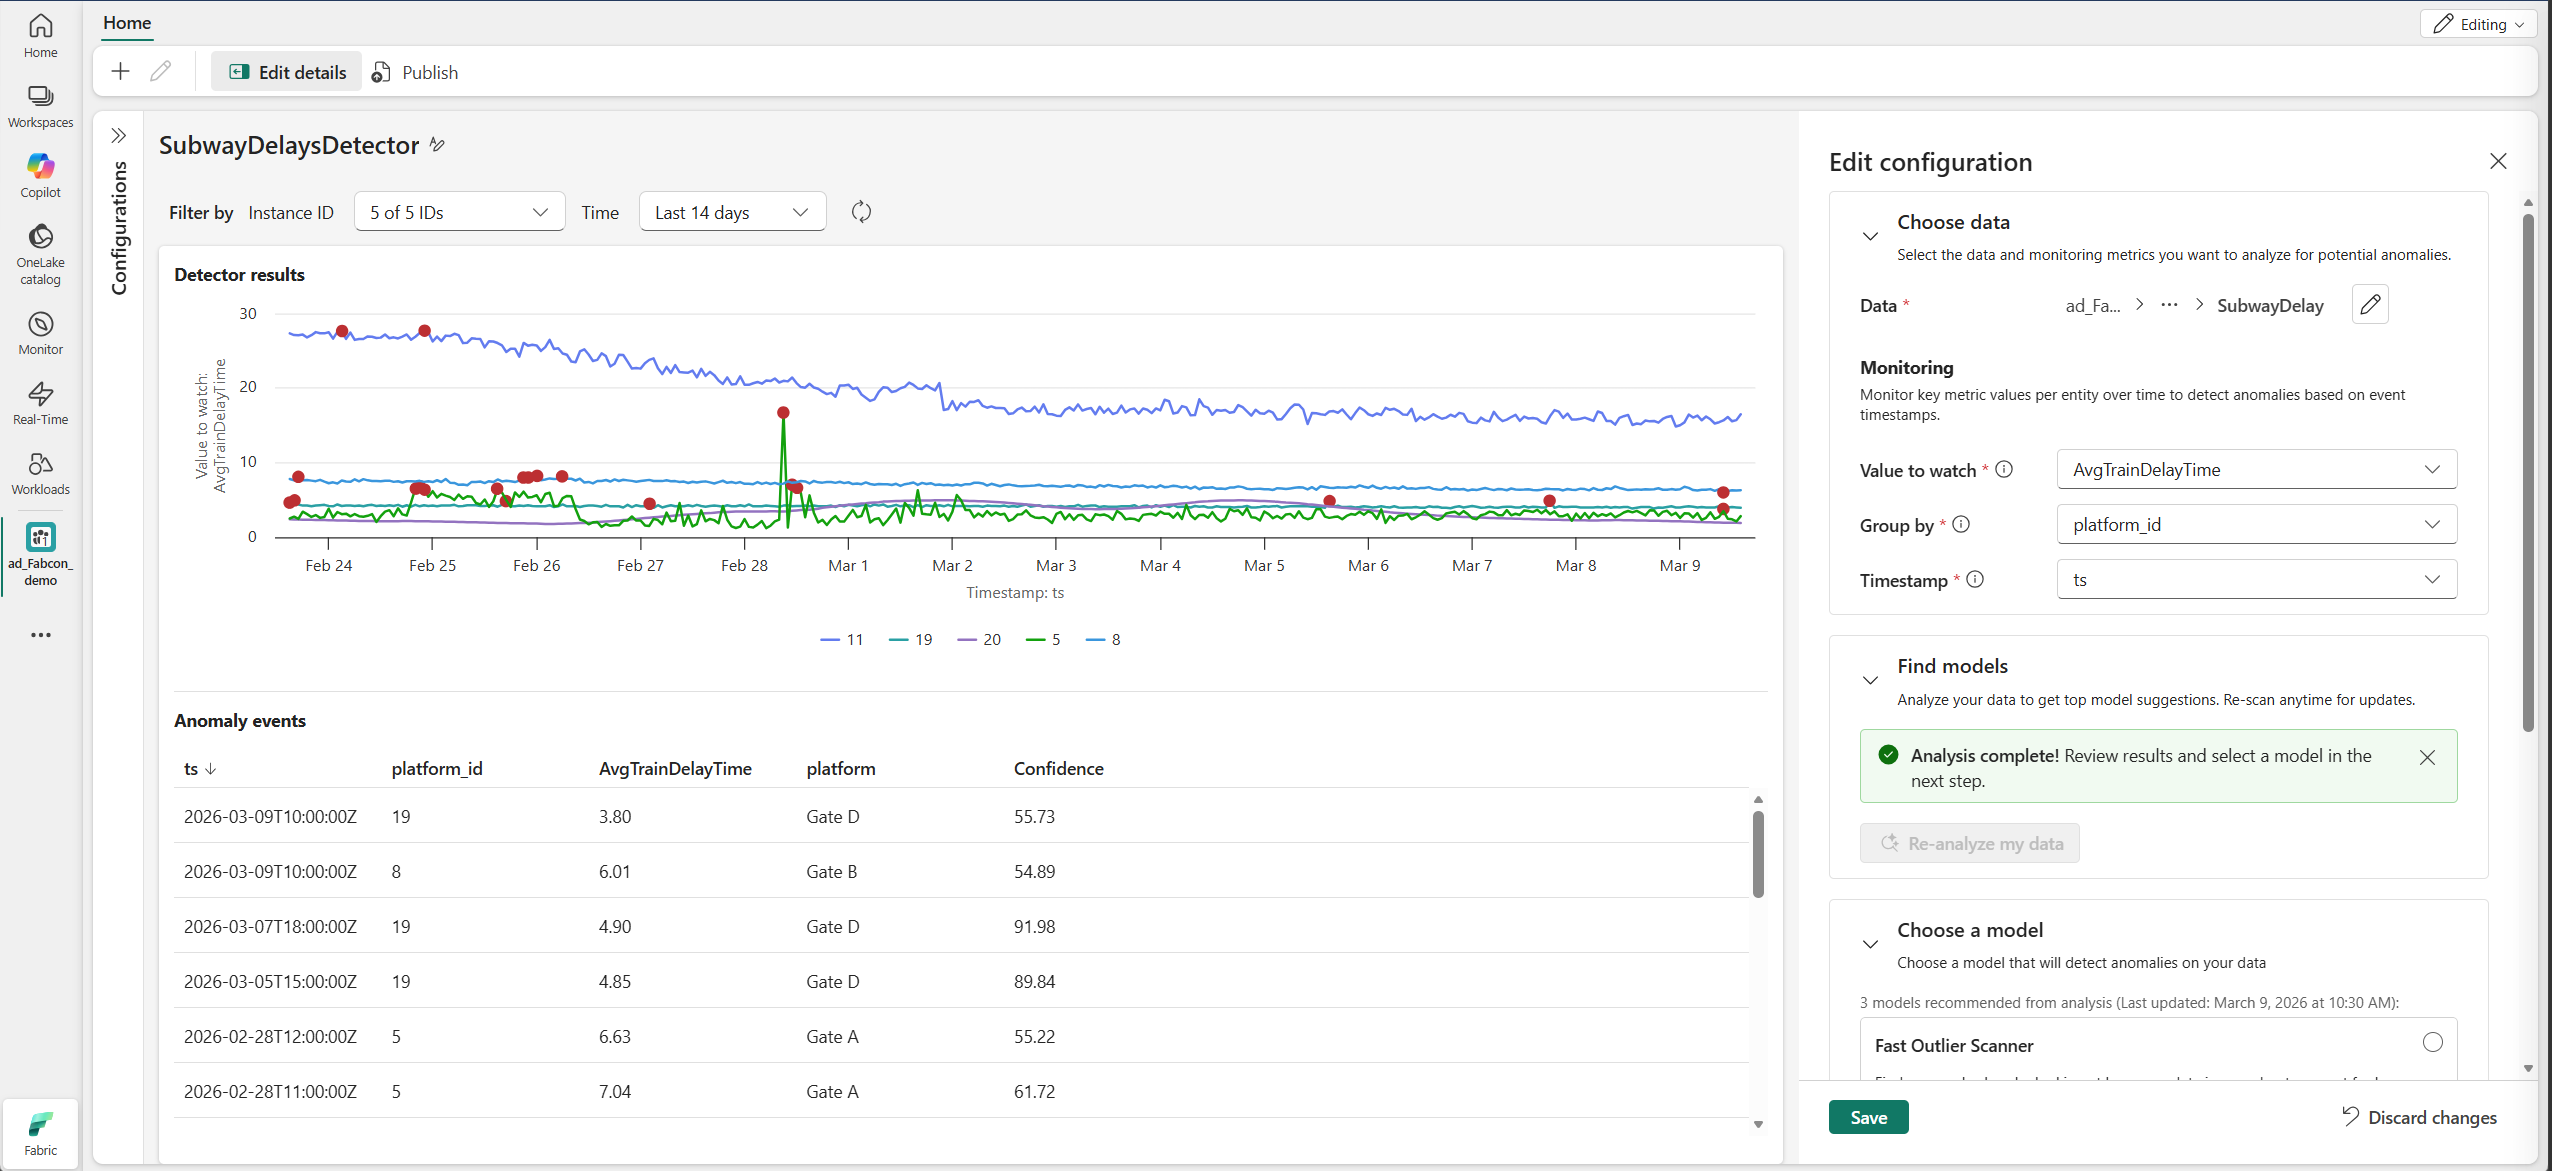
Figure: An updated Anomaly Detection UI that simplifies setup, visualizes trends and anomalies in real time, and highlights high‑confidence events for faster investigation
The full item Anomaly Detector experience also sets the stage for deeper investigation and richer insights. By consolidating analysis and results into a unified view, you can spend less time navigating and more time understanding what’s changing in your data. Whether you’re monitoring operational metrics or exploring unexpected behavior in real-time signals, these improvements help you move from detection to insight faster and with greater confidence.
Operations agent playbook improvements and messages
This month sees several improvements for operations agents’ ability to monitor your data and take actions. Based on usage and feedback we’ve heard so far, operations agents are better at mapping between your instructions and the fields in the Eventhouse you connect them to. You’ll also see they can build different types of rules to monitor the specific conditions in your data, including comparing string values in the data and counting data points over time.
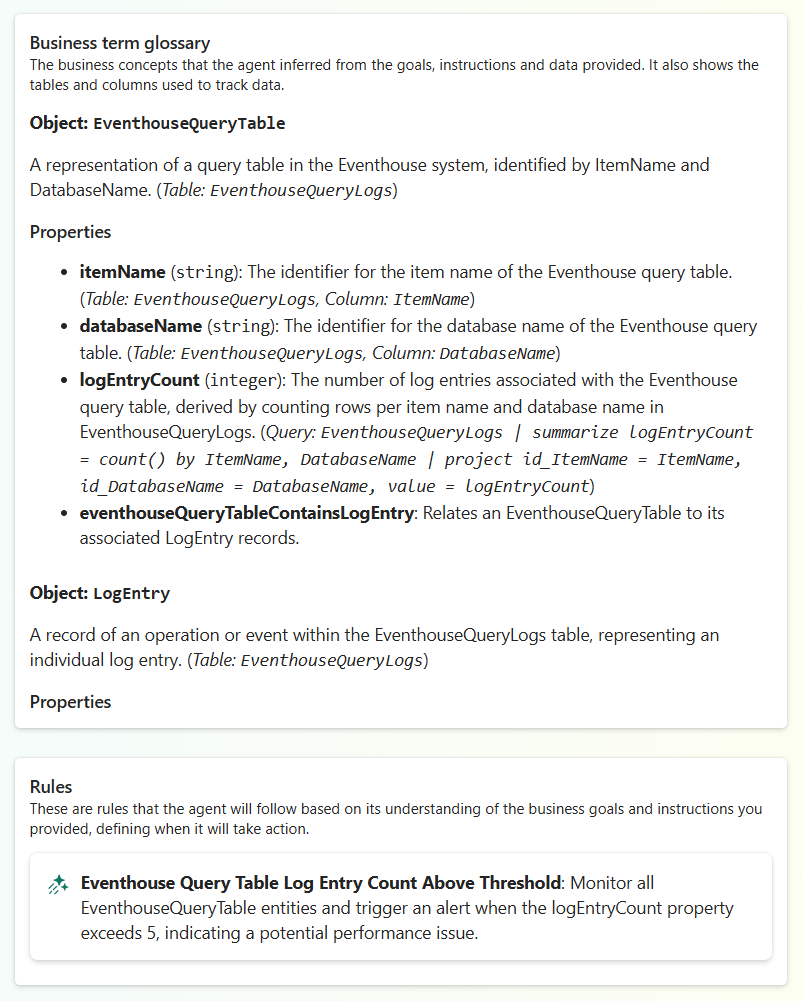
Finally, you’ll also see better messages if the agent can’t generate a playbook based on the data, goals, and instructions you’ve configured. In those cases, the LLM will try and describe the issue for example not being able to ground a field it inferred from your instructions to a field in the Eventhouse KQL database, or the parameters for a condition or action not being clear in the instructions. For example:
This makes it easier for you to debug and unblock the agent configuration.
Finally, we’ve updated our best practices and sample for how to give guidance and steering to the operations agent for it to follow your instructions. Learn more about this in the Operations Agent Best Practices and Limitations documentation.
Live update for Real-Time Dashboards
Real-Time Dashboards now support Live update, a feature that automatically refreshes dashboard visuals when new data is ingested into your underlying data sources. Instead of relying on fixed-interval refresh – which polls your data source on a set schedule regardless of whether new data exists – Live update uses a lightweight background query to detect when data arrives and triggers a refresh only when needed.
This event-driven approach offers several benefits. Your dashboards stay current without the compute overhead of constant polling, making it particularly valuable for high-frequency data monitoring scenarios where you need to see data the moment it arrives. For organizations running multiple dashboards or monitoring large data volumes, Live update reduces compute load by eliminating unnecessary refresh cycles during quiet periods.
Dashboard viewers also gain flexibility with the ability to pause live updates temporarily. If you’re investigating a specific data point and don’t want the visuals to change, you can pause updates to analyze the current state without interruption, then resume when you’re ready to return to real-time monitoring.
Dashboard editors can enable Live update through the dashboard settings, with configuration options including Live update (recommended), manual update only, or a fallback refresh interval for visuals that don’t support ingestion detection.
Learn more about configuring Live update for your dashboards, with the What is Real-Time Dashboard? documentation.
Eventstream SQL Operator (Generally Available)
During preview, the Eventstream SQL Operator introduced SQL-based stream processing in Fabric, enabling customers to transform live event data using familiar SQL with rich authoring, preview, and debugging capabilities.
Write to multiple destinations from a single SQL operator
Consolidate your real-time processing logic into one streamlined SQL block and route results to multiple destinations in a single step. This simplifies pipeline design, making it more efficient and lowers operational overhead.
The updated authoring experience makes it easy to add multiple destinations directly within the SQL editor and preview results for each output independently. During testing, dedicated output previews let you validate transformations before you publish.
Figure: Route data to multiple destinations from one SQL operator.
Event ordering and late event arrival handling
Configure event ordering policies directly within the SQL operator to handle late-arriving and out-of-order events. Define thresholds for how long to wait for delayed data and ensure accurate, event-time–correct processing—even in the presence of network delays or asynchronous producers. These policies help build more resilient real‑time pipelines that reflect how data behaves in the real world—not just in perfect conditions.
Learn more about Fabric Eventstream SQL Operator.
Together, these enhancements make Eventstream SQL Operator more powerful, more intuitive, and ready for production‑grade real‑time workloads.
Anomaly Detection as a source in Eventstream
Anomaly Detection can be added as a source in Fabric Eventstream, allowing you to publish anomaly events directly into your Eventstream for processing and action. You can add Anomaly Detection as a source from either Eventstream or Real-Time Hub. You can enrich your anomaly events by adding business context and additional information. Further, you may route real-time events to downstream workloads for automated alerting and dashboard visualization.
Where to Add This Source
You can add Anomaly Detection as a source in two ways:
- From Eventstream – Create a new Eventstream, select Anomaly detection events as a source.
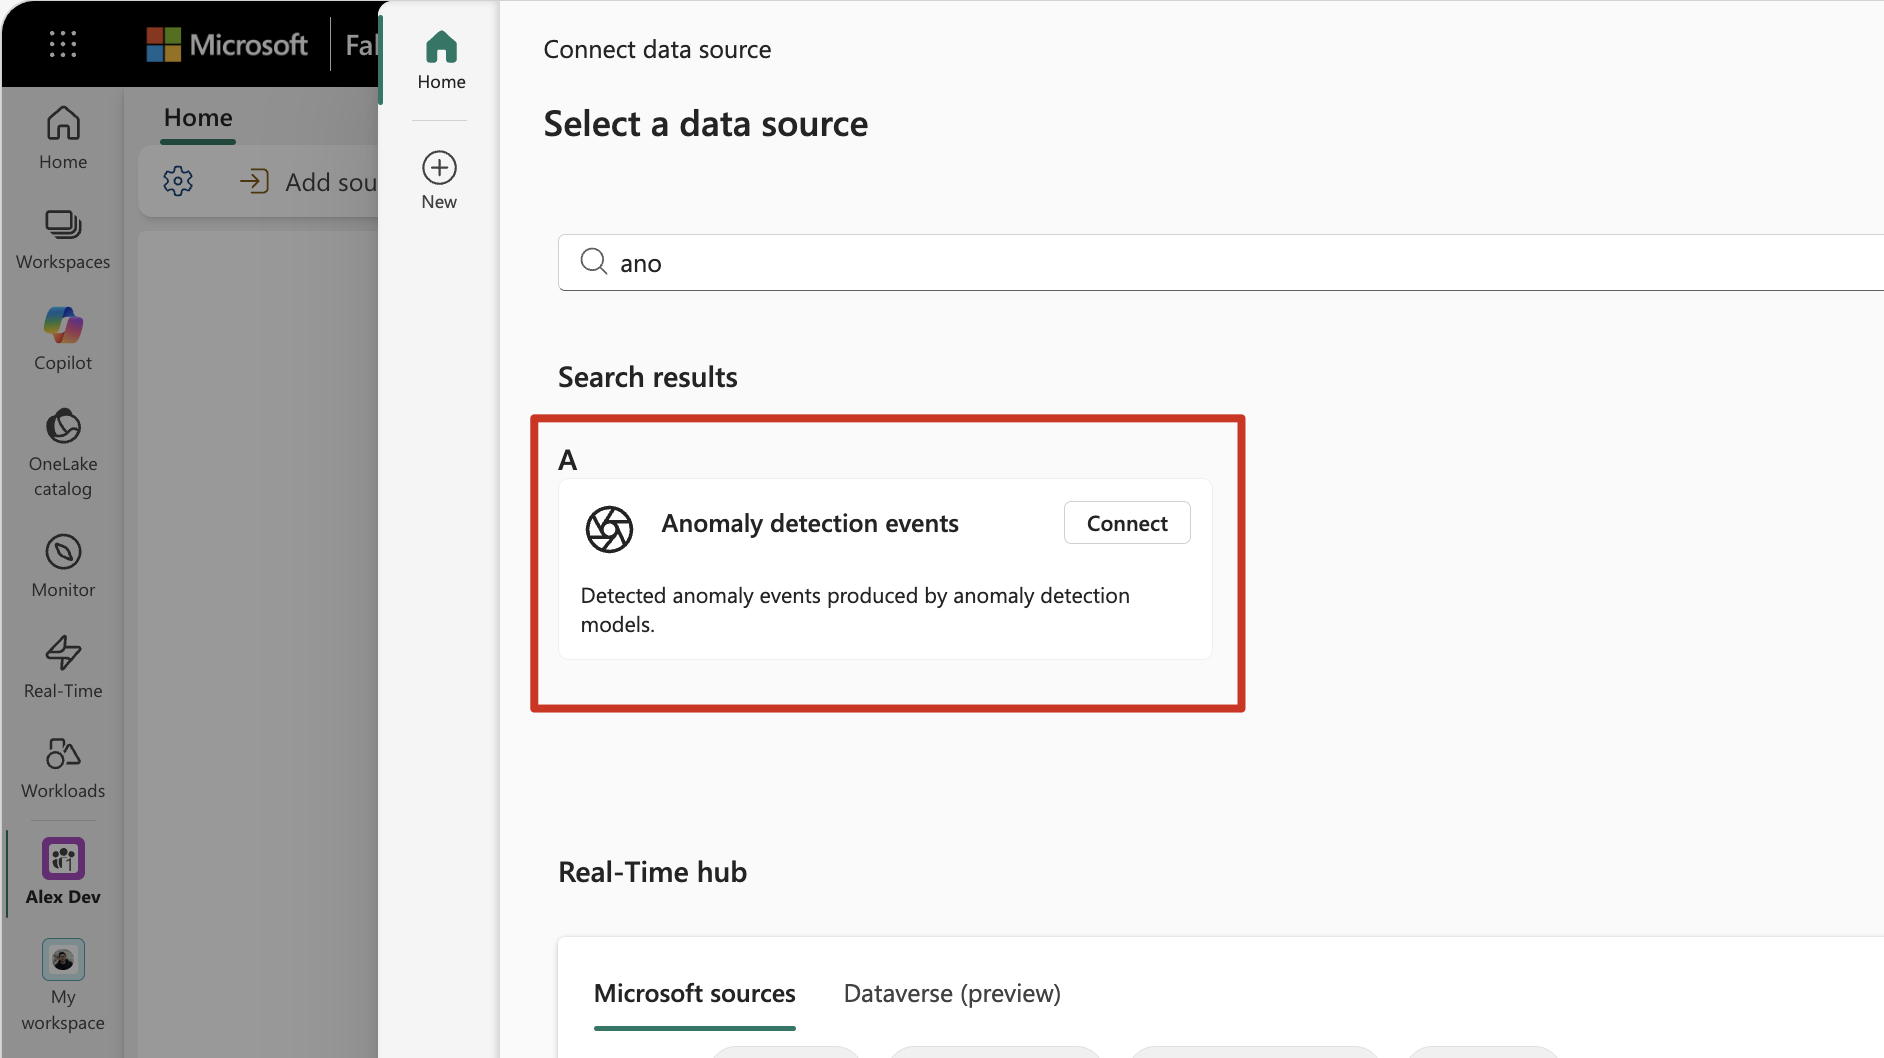
Figure: Adding Anomaly Detection source within Eventstream
- From Real-Time Hub – Navigate to Real-Time Hub, find the Fabric events and select Anomaly detection events.
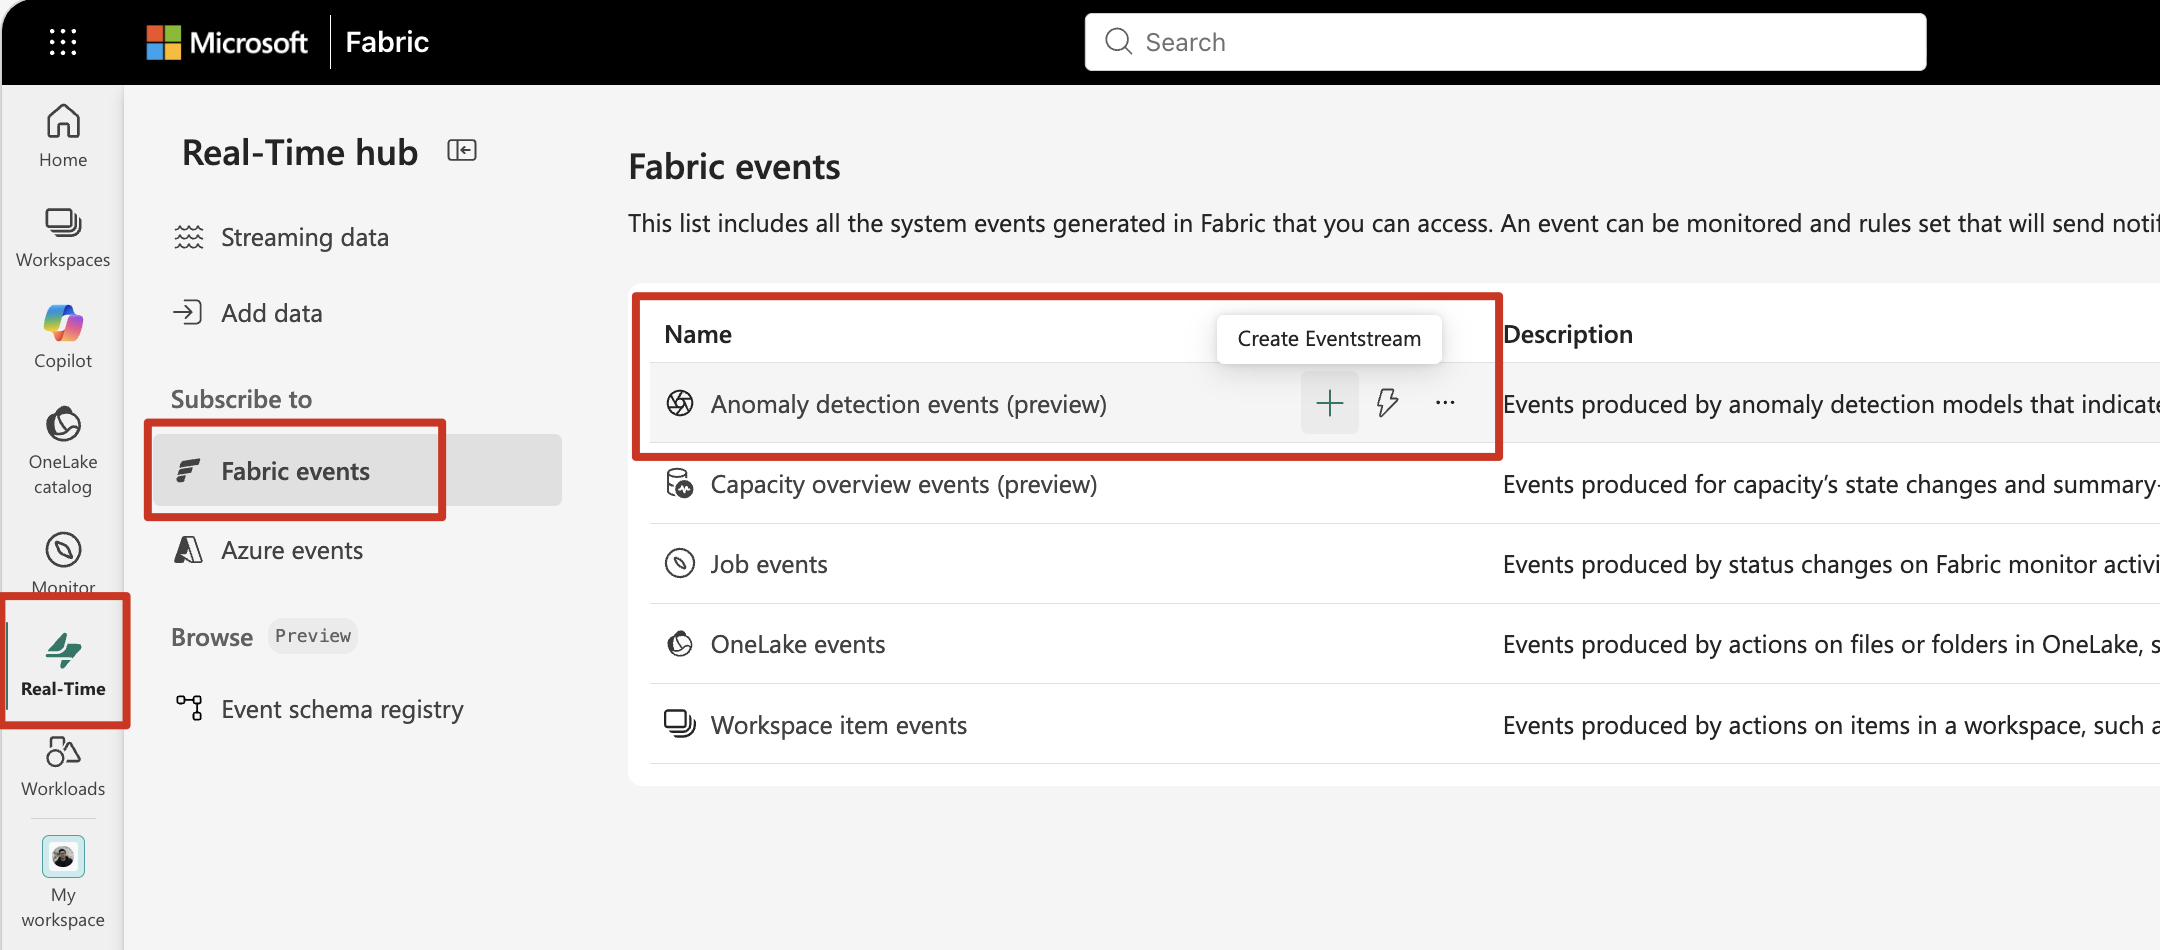
Figure: Adding Anomaly Detection events in Real-Time Hub
Once added, anomaly events flow seamlessly into your Eventstream, ready for transformation and routing to downstream workloads.
Get Started
Anomalies are now another streaming event—ready to be transformed, enriched, and acted upon. Try out Anomaly Detection as a source in Eventstream today and unlock the power of real-time anomaly pipelines.
Learn more about this in the Operations Agent Best Practices and Limitations documentation.
Data series colors for real-time dashboard visuals
When monitoring operational data, color choices matter. A status indicator showing “Critical” in red and “Healthy” in green communicates meaning instantly—viewers can interpret the visual without reading legends or labels. With data series colors, you can make these intentional choices rather than accepting system defaults.
To configure data series colors, switch to Editing mode, select the Edit icon on your tile, and expand the Data series colors section in the Visual tab of the formatting pane. From there, you can select a color for each data series in your visual.
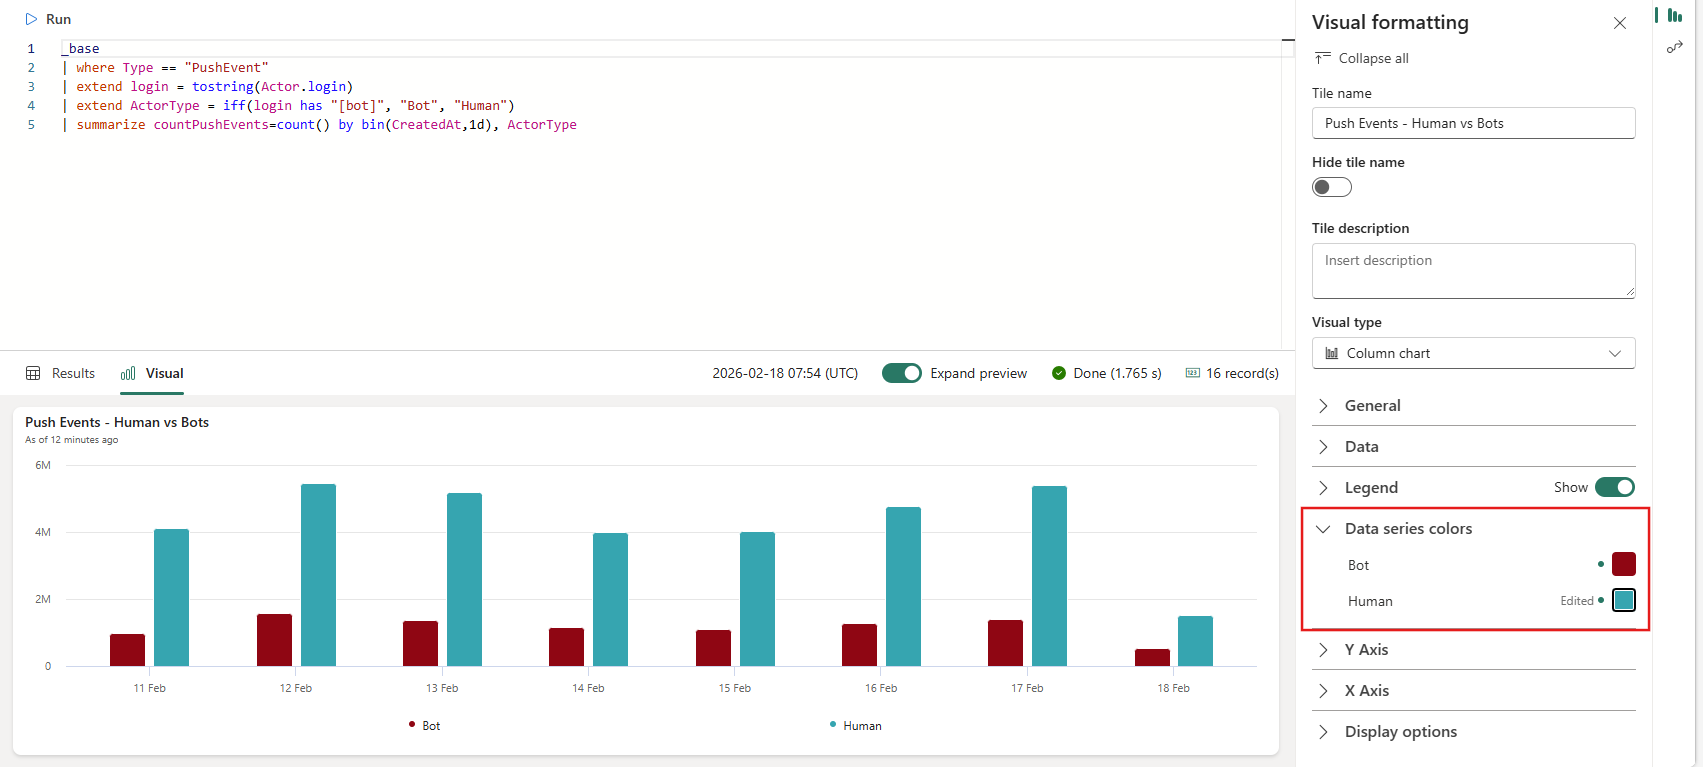
Figure: Visual formatting: data series colors setting
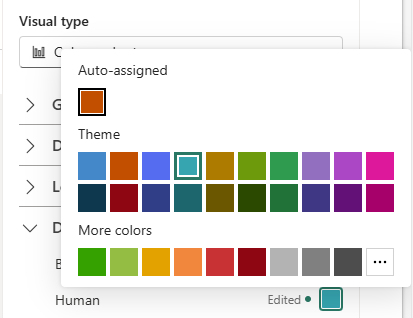
Figure: Color palette for setting visual elements colors
Learn more about customizing your Real-Time Dashboard visuals, refer to the Customize Real-Time Dashboard visuals documentation.
Use Copilot to create visuals in real-time dashboards (Preview)
Dashboard editors can now use Copilot to create and edit visuals in Real-Time Dashboards using natural language. When you’re in Edit mode, open the Copilot pane while creating a new tile or editing an existing one. Describe the insight you need – for example, “Show me the top 10 repositories by push events this week” – and Copilot generates the KQL query, returns the data, and suggests a visual that fits your results.
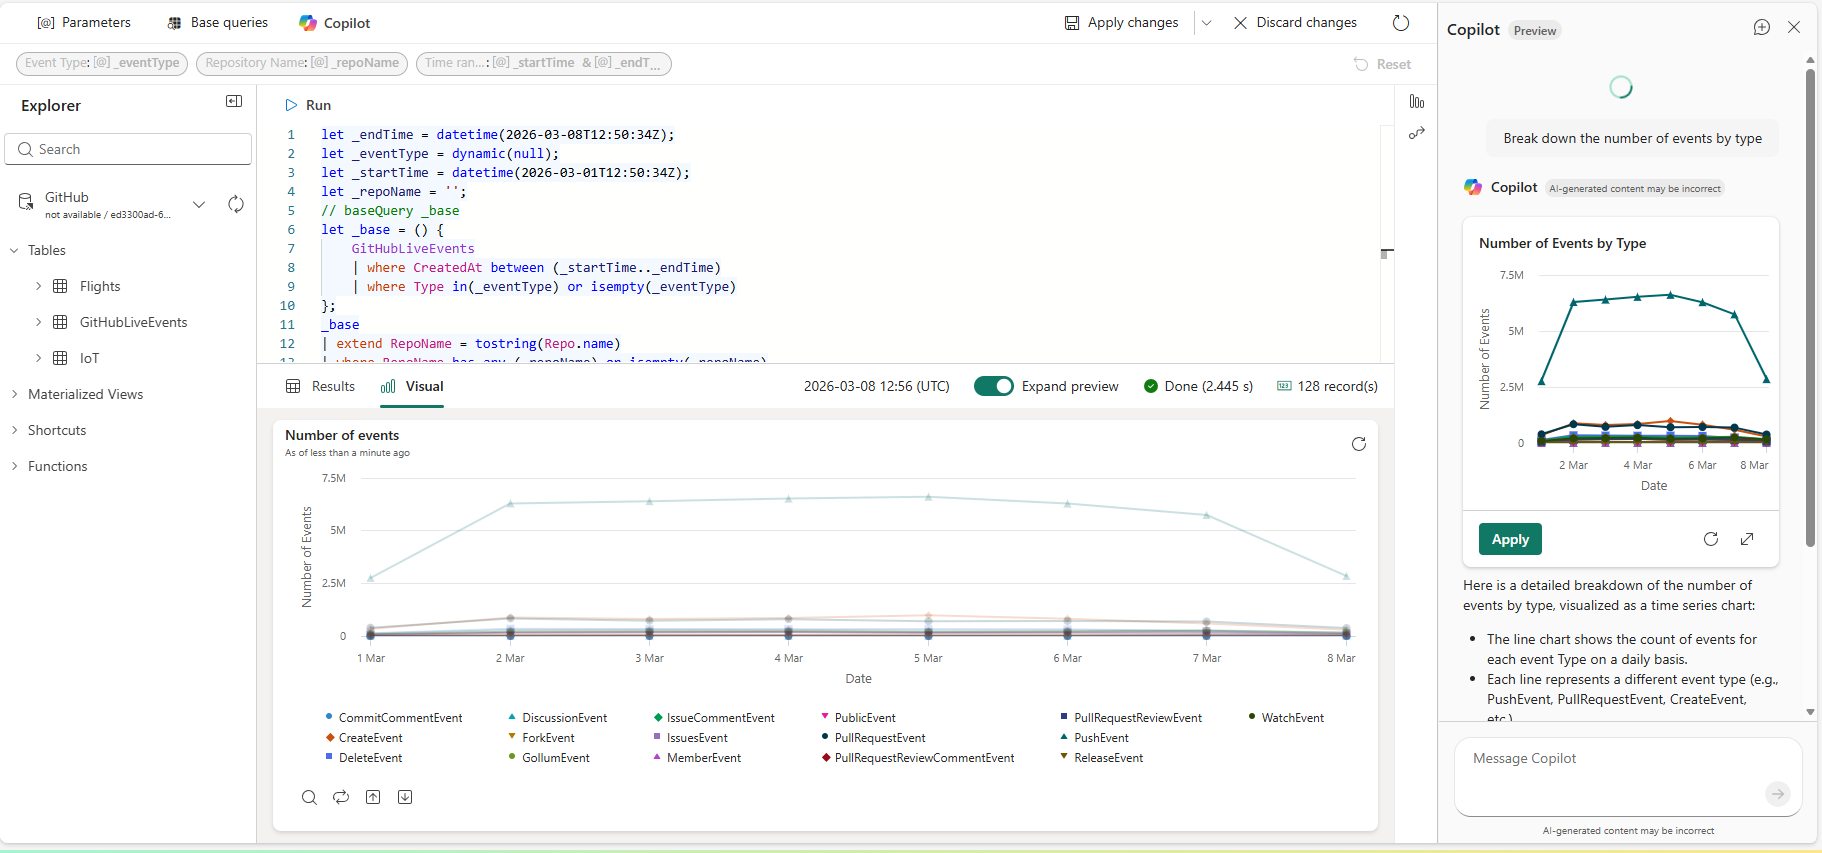
Figure: Real-time dashboard visual in edit mode after Copilot answer has been applied
You can accept Copilot’s suggestion, refine your question with follow-ups like “Group by event type” or “Filter to the dotnet organization,” or edit the query directly. Once you’re satisfied, add the visual to your dashboard and use the no-code formatting options to customize its appearance.
To learn more, refer to the Copilot-assisted real-time data exploration documentation.
Instantly run and preview functions in Microsoft Fabric Eventhouse: no code required (Preview)
Previously, working with an Eventhouse function involved manually writing KQL queries. You needed to enter the function name, provide parameters in the right format, and execute the query just to see what results you would get. If you wanted to view the function’s body or metadata, you had to run a separate command. That’s no longer the case.
With the new Preview Functions capability in Microsoft Fabric Eventhouse, you can open the function definition, run the function, and instantly preview its results, with no manual KQL, no parameter guesswork, and no extra commands.
Why this matters
Eventhouse functions are powerful, but environments evolve. Databases grow, teams change, and you often inherit functions you did not write.
Instead of guessing what a function does or manually building a query just to test it, you can:
- View the function definition instantly.
- Run the function and preview results with a single click.
- Test parameterized functions interactively.
- Browse your function list with search and sorting.
This removes friction from everyday workflows. Whether you are exploring unfamiliar logic, validating outputs before building reports, or troubleshooting unexpected results, you get clarity in seconds instead of minutes.
How to view or preview a function:
- In DB Explorer, expand Functions and select a function. A read-only version of the function opens.
- Select Preview results to instantly run the function and see the output. If the function has parameters, enter your values and preview the results based on your input.
- The preview shows up to 100 records, providing a quick snapshot of the function’s output.
Figure: DB Explorer with the Functions folder expanded and a function selected. The function opens in read-only mode, and the Preview results option is available to run the function and display the output, with fields provided to enter parameters
You can view a complete list of all stored functions, including their folder, description, and optional sorting. Built-in search makes it easy to find specific functions, making navigation and discovery simple even in large databases.
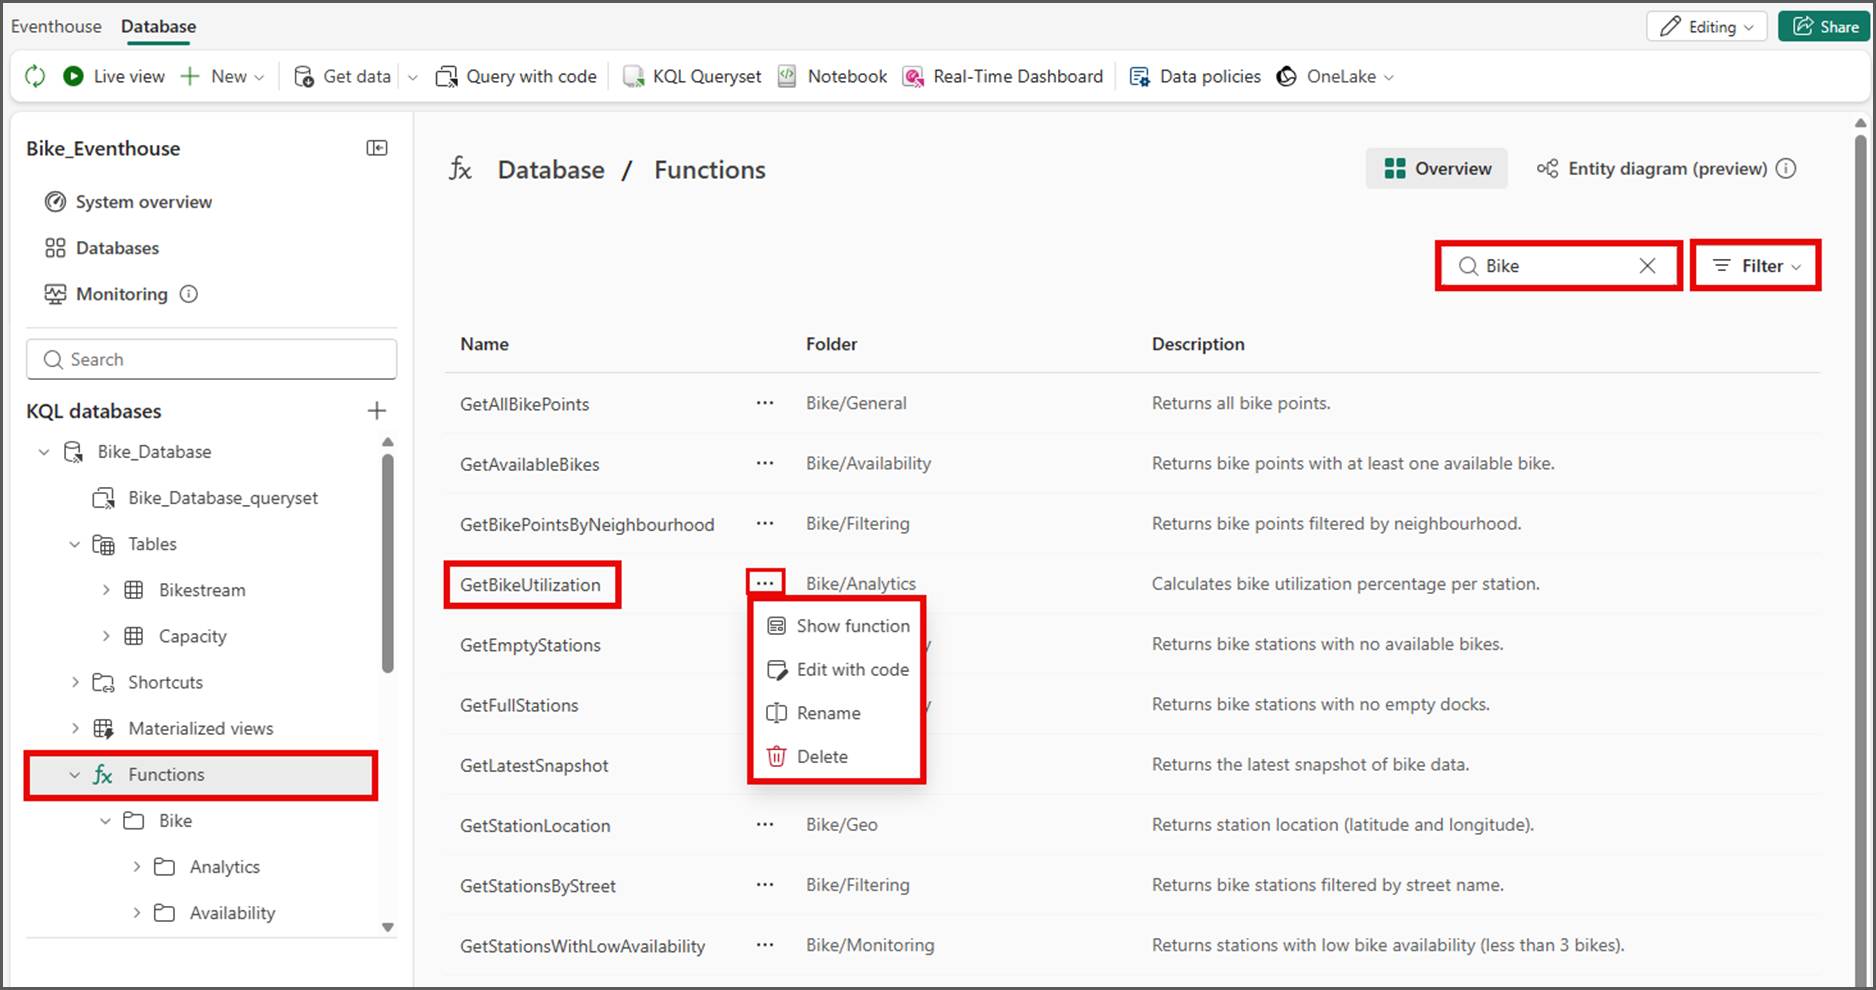
Figure: Functions list with all available functions in the database, with options to sort, search, and open a menu with additional actions
The new Run & Preview Functions feature in Microsoft Fabric Eventhouse lets you instantly inspect function definitions and preview results without writing KQL or handling parameters manually. Quickly explore, test, and manage all your stored functions in one place, saving time and reducing friction.
Learn more with the Stored functions list documentation.
Workspace monitoring dashboard templates in Microsoft Fabric Eventhouse (Preview)
Fabric workspace monitoring provides rich telemetry across your workspace assets, including Eventhouses, Power BI Semantic Models, Data Engineering (GraphQL), and Mirrored Databases. The workspace monitoring data is stored in an Eventhouse, part of Fabric Real-Time Intelligence.
To help you turn this data into actionable insights, we have created ready-to-use real-time dashboard templates with out-of-the-box visualizations. Currently, two templates are available: one for Eventhouse items and one for semantic models.
From any Workspace Monitoring Eventhouse, users can create these dashboards directly. To get started, go to your Workspace Monitoring Eventhouse, open the upper ribbon, and select Fabric Monitoring.
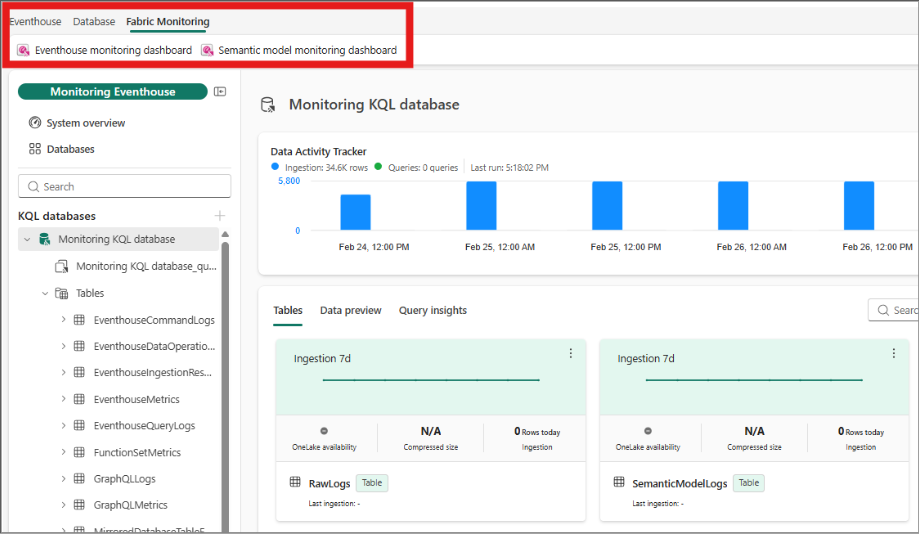
Figure: The ribbon in the Workspace Monitoring Eventhouse allows you to create out-of-the-box dashboards for monitoring
From there, choose to create:
- Eventhouse Monitoring Dashboard—to monitor Eventhouse items in your workspace. You can track:
- Ingestion results and logs.
- Commands and queries monitoring.
- Metrics related to Eventhouse performance.
- Identify periods of high or unusual Analysis Services engine activity by capacity, workspace, report, or user.
- Analyze query performance and trends, including external DirectQuery operations.
- Track semantic model refresh durations, overlaps, and processing steps.
- Monitor custom operations sent using the Premium XMLA endpoint.
Once created, the dashboards are ready to use immediately, giving you instant visibility in your workspace. You can also customize them to fit your specific needs.
These templates make it fast and easy to track, analyze, and act on workspace activity, all in one place. Learn more in the documentation: Visualize your workspace monitoring .
Databases
Database Hub in Fabric
The Database Hub in Fabric is a new unified database management experience that brings databases across edge, on‑premises, cloud, and Fabric into a single, coherent view. It provides teams with one place to explore, observe, govern, and optimize their entire database estate.
Built for scale, the Database Hub uses agent-assisted intelligence to continuously reason over estate-wide signals, surface what changed, explain why it matters, and guide teams toward the right next actions. With built-in observability, delegated governance, and Copilot-powered insights, database agents help teams move from insight to action faster, while humans remain firmly in control of goals, boundaries, and trust. The result is a simpler, more confident way to manage databases at scale today, and a foundation for increasingly autonomous, intelligent database operations over time.
SQL database in Fabric
Since reaching general availability in November 2025, SQL database in Fabric has seen rapid customer adoption as organizations modernize SQL workloads with less operational overhead and tighter integration with analytics and AI. Guided by customer feedback, the platform emphasizes simplicity, autonomy, security, and AI optimization. We are introducing a set of improvements and new features that make it easier to migrate, manage, and optimize SQL workloads in Fabric:
- Simplified migration with new assistant: The Migration Assistant in public preview helps SQL developers move SQL Server and Azure SQL workloads into Fabric by importing schemas, assessing compatibility, and guiding migration with minimal manual effort.
- Configurable autonomous management: While maintaining a SaaS-first approach, new options allow database-level control over vCore scaling, expanded compatibility levels, enhanced T-SQL features, and settings that ease application transitions without code changes.
- Support for all collations: All Azure SQL database collations are supported when creating a new SQL database in Fabric for enhanced global data compatibility and app development flexibility. Collations control text sorting and comparison in SQL databases, impacting filtering, searches, and multilingual content management. Users can specify collations seamlessly during database creation via the REST API across deployment methods.
Check out the How to set a different collation for SQL database in Fabric demo and explore the sample code in Git repo.
- Enhanced data mirroring and security: Auditing and Customer Managed Keys are generally available. CMK for Fabric SQL lets you encrypt databases with your own Azure Key Vault keys to gain full control over key ownership, access, rotation, and compliance. Users can selectively manage which tables are mirrored to OneLake for immediate analytics access.
- AI and monitoring integration: SQL database in Fabric supports vector search with DiskANN and integrates with Azure AI Foundry for advanced semantic search and AI scenarios, alongside workspace performance dashboards for unified monitoring and optimization.
- Enhanced data recovery: In Fabric, when a database is deleted, it goes into a soft-deleted state into the Fabric Workspace’s Recycle Bin tab. Depending on the retention configured, the deleted database can be recovered from the Recycle bin while in retention. In addition to this Recycle bin experience, the Fabric SQL database also has the backup retention period configurable from 1-35 days. When the database is hard deleted from the Recycle bin, the backups are still available for the configured backup retention period. This new improvement allows you to restore the backup into a new database to any point in time within the restorable period.
Cosmos DB mirroring with Private Link and VNET
Cosmos DB mirroring with Private Link and VNET enables customers to mirror data from privately secured Azure Cosmos DB accounts into OneLake. This allows organizations to maintain consistent network security and compliance while supporting near‑real‑time analytics and AI workloads in Microsoft Fabric—strengthening Fabric’s enterprise readiness by design.
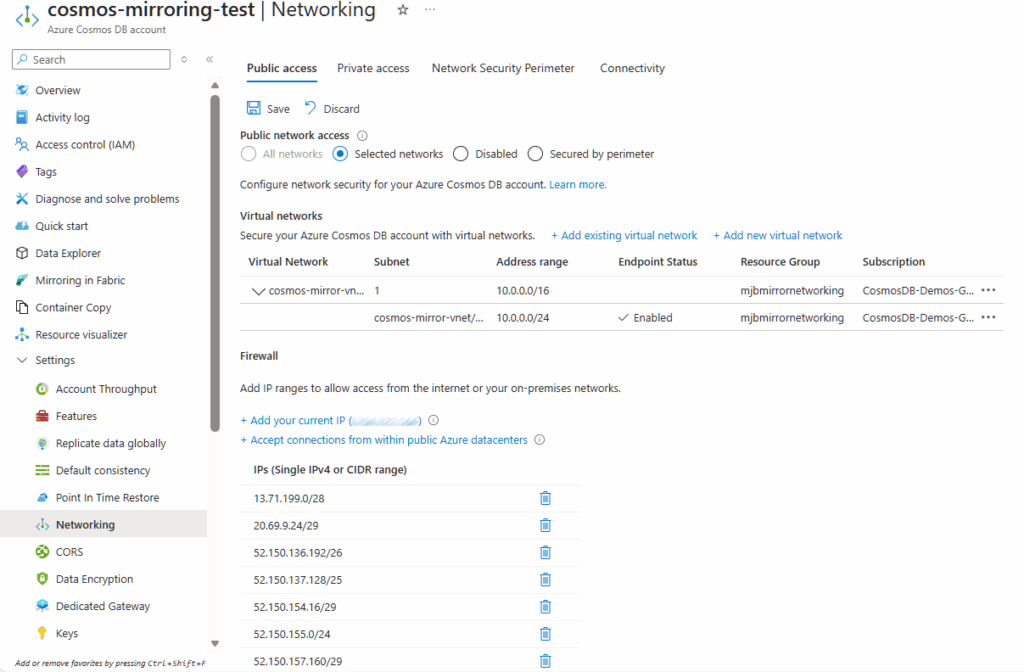
Figure: Mirroring data from Azure Cosmos DB accounts secured with Private Endpoints or VNETs into OneLake
To learn more, refer to the Cosmos DB Fabric Mirroring for Private Networks documentation.
Data Factory—Copy Job
Richer Change Data Capture (CDC) with Oracle, Fabric DW, and SCD Type 2
Copy job continues to improve the no‑code CDC experience with richer, enterprise‑ready replication patterns. This release introduces a set of enhancements in Copy job in Microsoft Fabric Data Factory that make CDC replication more powerful and easier to use without writing code:
- Oracle CDC source—Capture changes directly from Oracle databases.
- Fabric Data Warehouse sink—Replicate CDC data into Fabric Data Warehouse.
- SCD Type 2—Preserve full history with valid dating, and handle deletes as soft deletes.
With built‑in SCD Type 2 and soft delete handling, Copy job automatically preserves every version of a record as it changes over time, instead of overwriting history. This makes it easy to answer point‑in‑time questions, support regulatory audits, and run accurate historical analytics—capabilities that traditionally require complex MERGE logic or custom code.
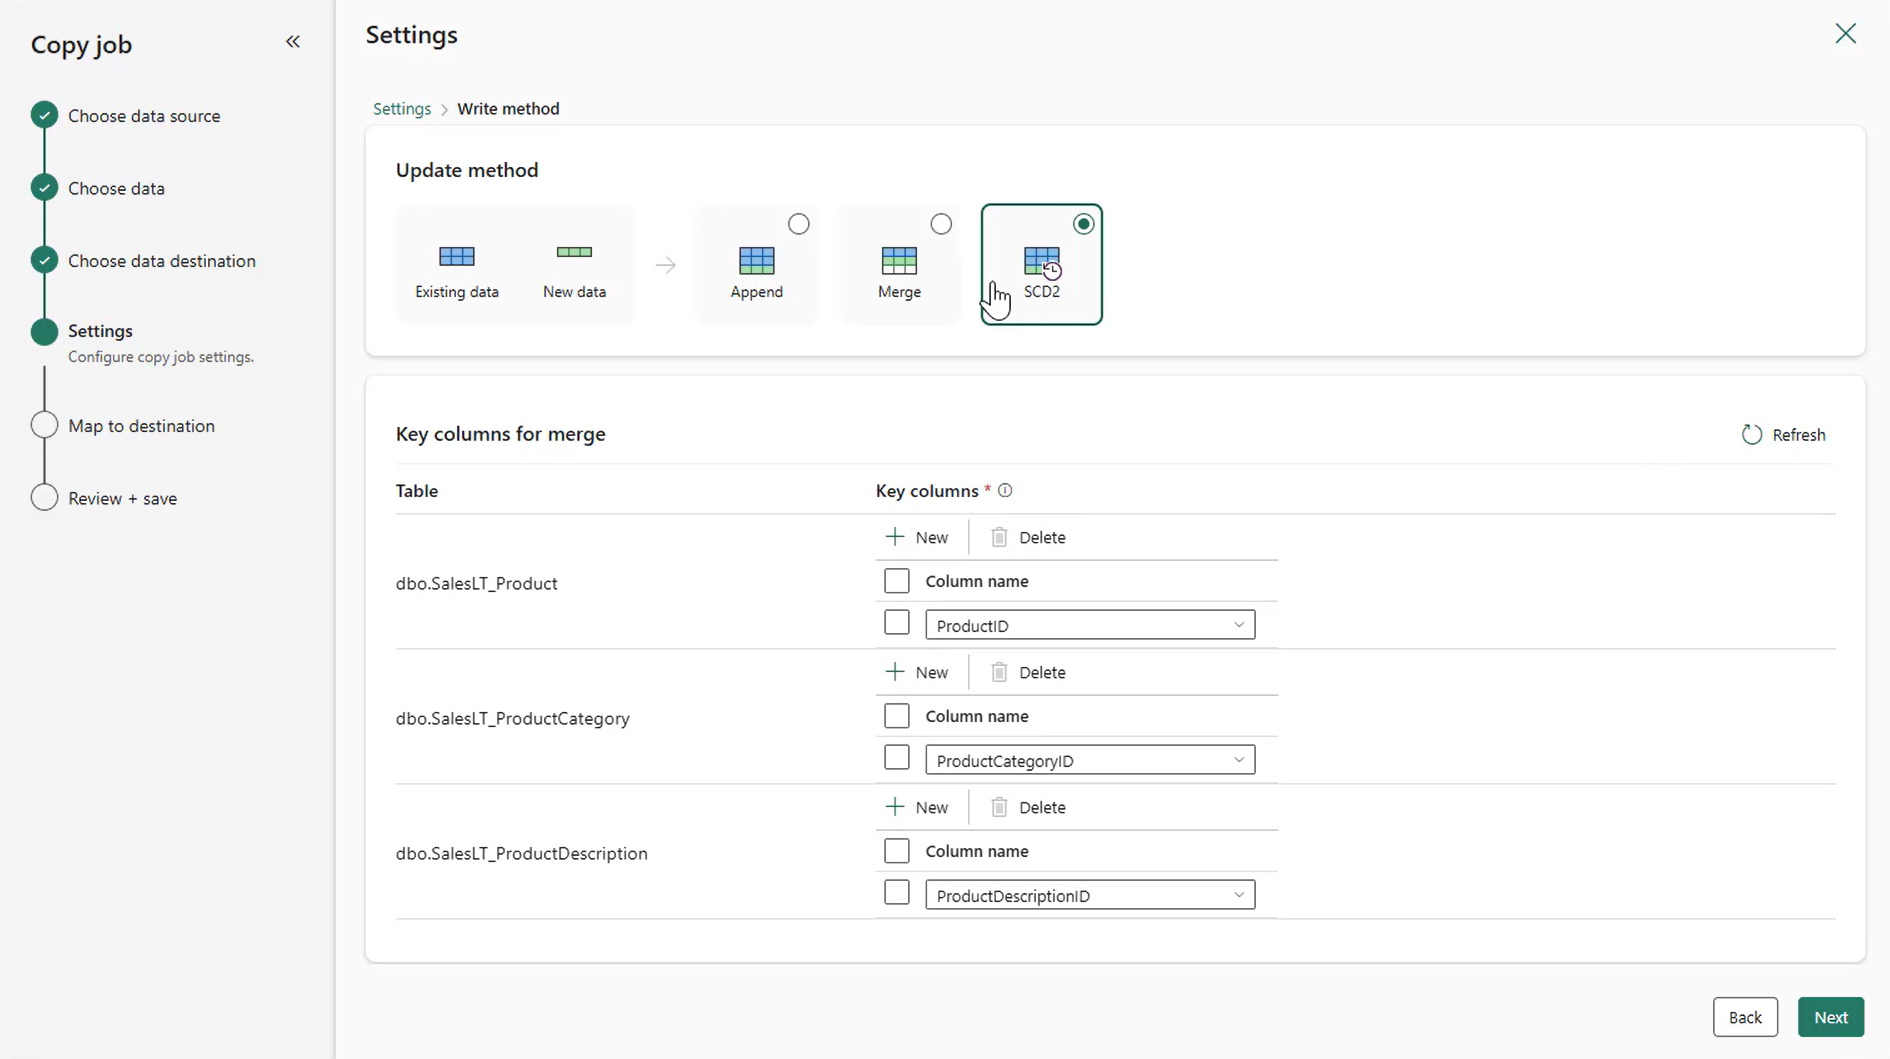
Figure: Enabling SCD Type 2 in Copy job with One Click
Learn more in the Change data capture (CDC) in Copy Job documentation.
Every row is traceable with built-in audit columns
Audit columns are additional metadata columns that Copy job can automatically append to every row it writes to the destination. These columns don’t come from your source data—they’re generated by the platform to describe the data movement itself.
When you enable audit columns in Copy job, each row in your destination table can be enriched with information such as:
Table: Audit column list
With audit columns enabled, you can answer the following questions for any row in your destination table:
- When was this data extracted? Exact timestamp from when the row was read from the source.
- Where did it come from? Which file path, which data store.
- Which job moved it? Which Copy job from which Workspace, which specific run, by name and ID.
- What was the incremental scope? Lower and upper bounds tell you exactly what slice of data this run covered.
No custom code. No expression authoring. Add as many audit columns as you want, and every row in every table your Copy job writes will include this metadata automatically.
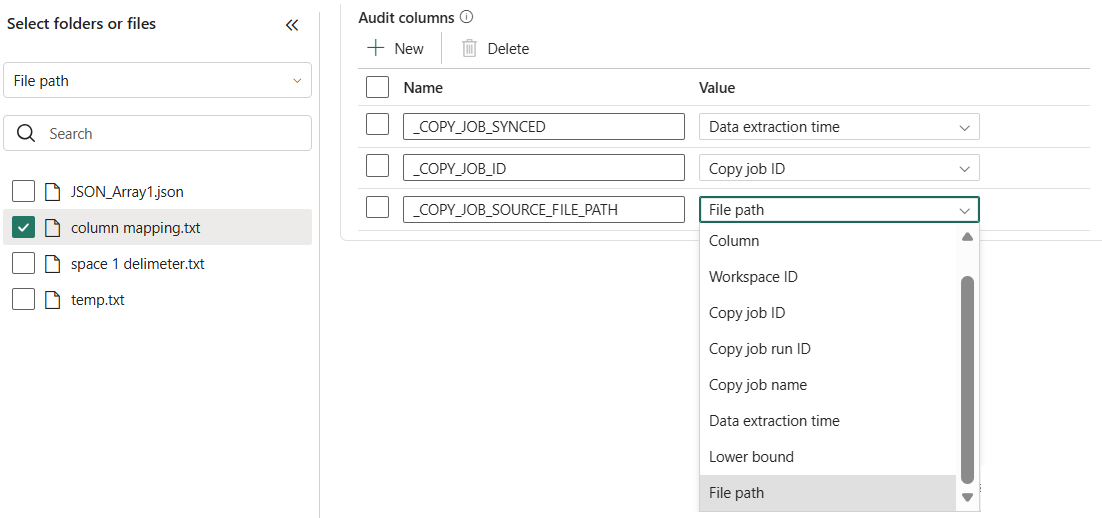
Figure: Setup audit column in Copy job.
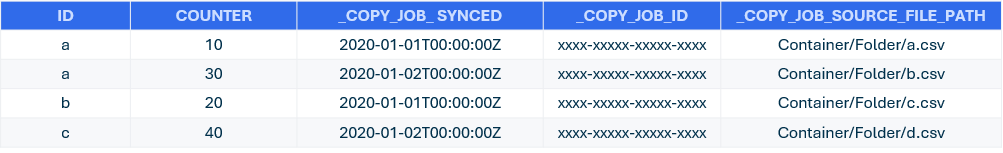
Figure: Output on destination data
Learn more in What is Copy job in Data Factory – Microsoft Fabric.
Workspace Monitoring for Faster, Scalable Troubleshooting
As Copy jobs scale from a handful to hundreds, visibility becomes critical. Fabric Workspace Monitoring brings centralized, log‑level observability to Copy job executions, streaming detailed run data into a query able Monitoring Eventhouse inside your workspace.
Teams can analyze failures, throughput, duration, and data volumes across all Copy jobs in one place—without inspecting jobs individually. With historical logs, cross‑item correlation, and integration with Data Activator for alerts, Workspace Monitoring helps DataOps teams detect issues earlier and troubleshoot faster at scale.
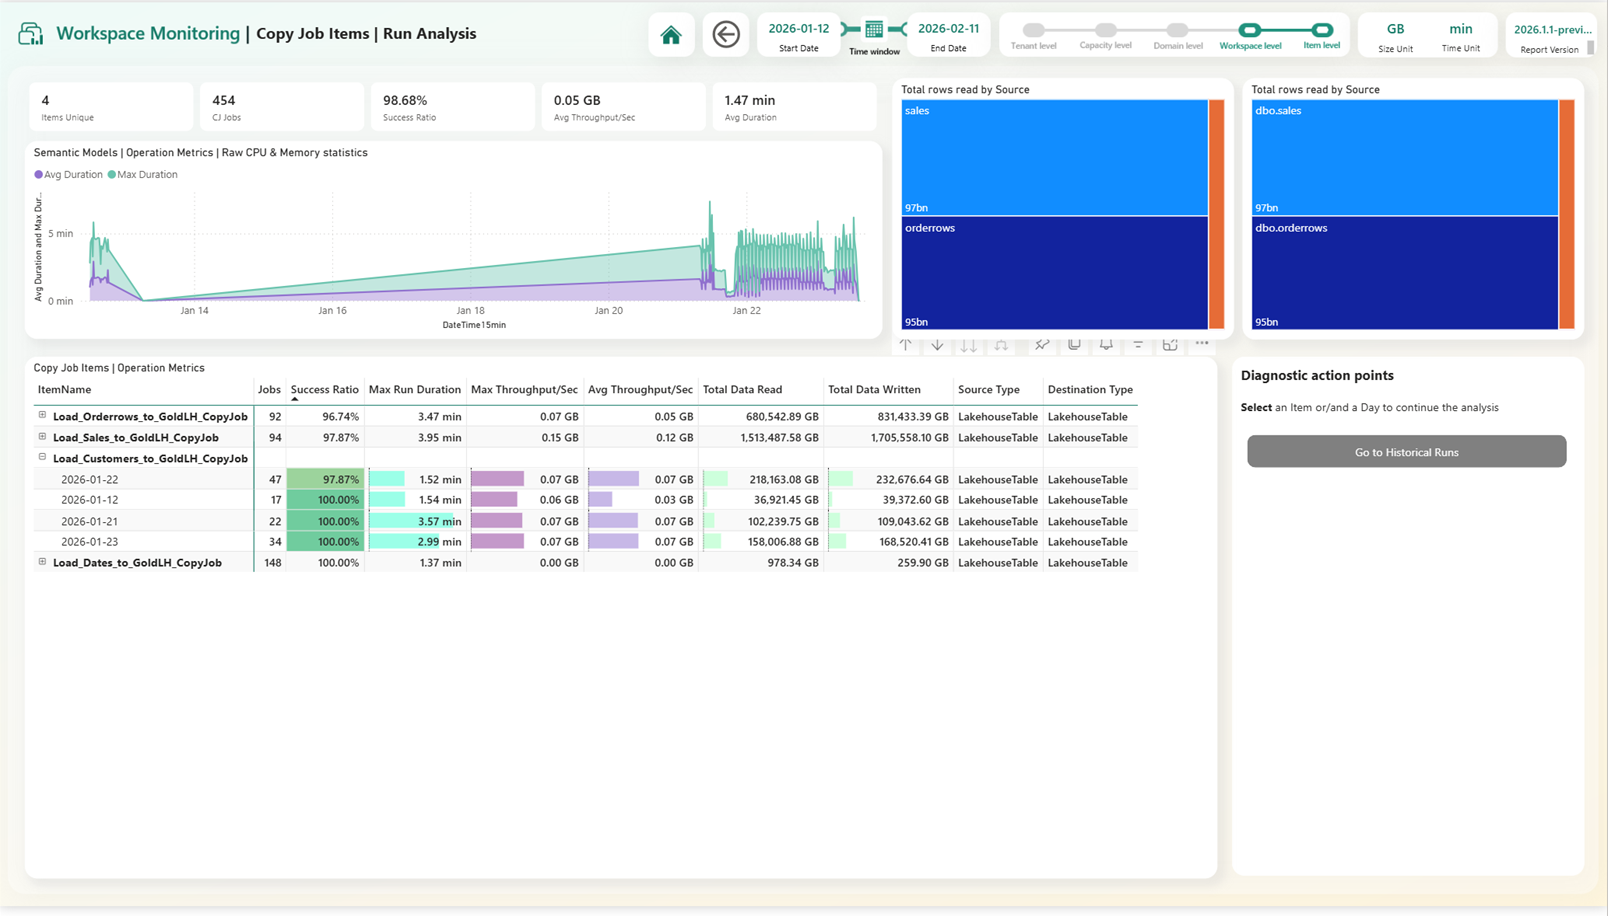
Figure: PBI Report against Fabric Workspace Monitoring metric from Copy job
Learn more in Workspace Monitoring for Copy Job in Microsoft Fabric – Microsoft Fabric
Boost performance automatically with AutoPartitioning
Moving large tables efficiently often requires careful partition tuning—but Copy job now does this automatically. With auto‑partitioning, Copy job detects large datasets and applies an optimal parallel read strategy without any manual configuration.
This delivers dramatically higher throughput out of the box, whether you’re copying millions or hundreds of millions of rows. The system adapts dynamically based on data size and source characteristics, ensuring consistent performance across tables while eliminating per‑table tuning effort.
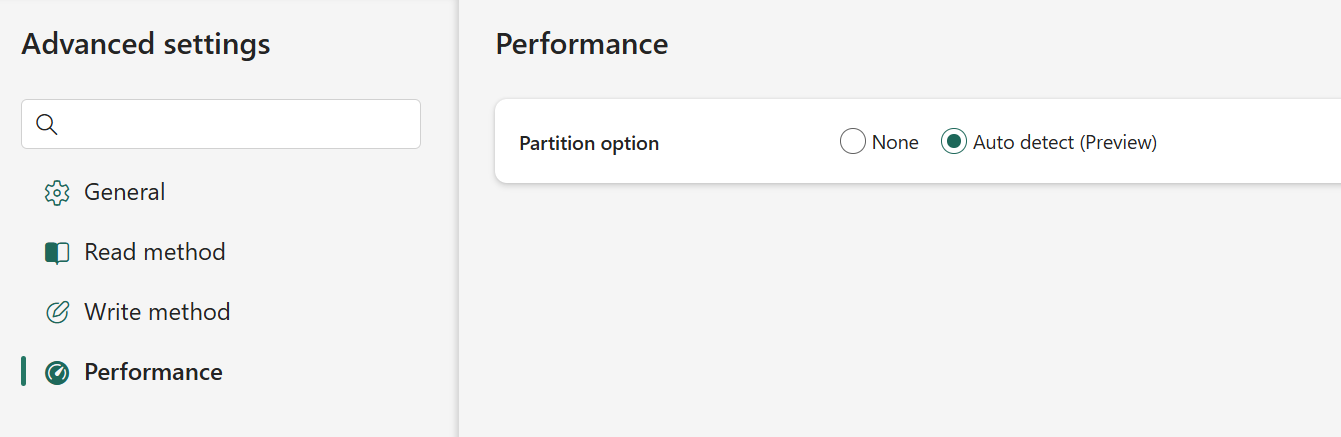
Figure: Enabling auto partitioning in Copy job
Learn more in What is Copy job in Data Factory
More flexible incremental copy with new watermark column types
Incremental copy is a core pattern for keeping analytics data up to date—but in real world systems, changes aren’t always tracked with a clean datetime column. To address this, Copy job now supports additional watermark column types, making incremental copy more flexible and applicable across a broader range of source systems
Copy job now supports ROWVERSION, Date, and String (interpreted as datetime) watermark columns. This allows you to choose the column that best represents change in your source system, while Copy job continues to automatically manage state, checkpoints, and incremental windows.
- ROWVERSION enables precise and reliable change tracking in SQL‑based systems, capturing every insert and update without relying on application‑managed timestamps.
- Date watermark support works seamlessly with common columns like LastUpdatedDate or ModifiedAt, with built‑in delayed extraction to prevent data loss or overlap between runs.
- String (interpreted as datetime) support removes the need for custom queries or schema changes when timestamps are stored as strings, improving compatibility with real‑world schemas.
These enhancements make incremental copy easier to configure, more resilient in production, and better suited for diverse enterprise data models—without adding complexity for users.
Learn more in What is Copy job in Data Factory – Microsoft Fabric.
Data Factory—Dataflow Gen2
Preview-only steps (Generally Available)
This capability improves authoring performance without changing runtime behavior. Preview-only steps let you run specific transformations during data preview only, automatically excluding them from dataflow execution and refresh. That means your production logic stays exactly the same—while the authoring experience becomes faster, smoother, and more responsive.
This capability addresses a common challenge when building Dataflow Gen2 items: iterating on logic can be slow when previews must evaluate full datasets. Preview‑only steps make it possible to temporarily reduce data volume or complexity during development, enabling faster validation of transformations without introducing conditional logic or modifying the final query definition.
Common uses include filtering or isolating subsets of data to accelerate previews, testing transformation logic without waiting for full evaluation, and exploring new data sources while keeping production execution intact. Because preview‑only steps are ignored during refresh and run operations, they provide a safe way to optimize the authoring workflow without risking unintended changes in published outputs.
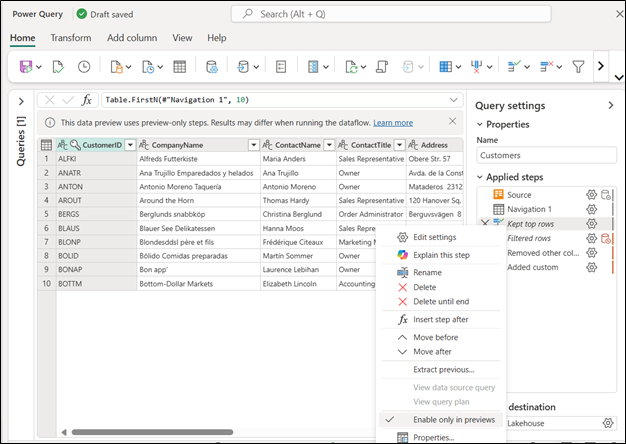
Figure: The “Enable only in previews” option within the applied steps section
Preview‑only steps are also integrated into specific authoring dialogs, including file system views and the Combine files experience. In these contexts, Dataflow Gen2 can automatically introduce preview‑only logic to limit sample data used during preview evaluation, further reducing load time while preserving the behavior of the final dataflow.
With general availability, preview‑only steps become a standard part of the Dataflow Gen2 authoring model—helping teams iterate faster, validate transformations more efficiently, and maintain a clear separation between development‑time experimentation and production execution.
Learn more: Preview only step in Dataflow Gen2 (Preview) – Microsoft Fabric.
Fabric Variable Library integration (Generally Available)
Throughout the last couple of months, we’ve removed some of the limitations such as:
- Variable limit: the previous limit was 50 variables. You can now reference as many variables as you need in your Dataflow.
- Power Query editor support and using a default value: you can now see how the variable gets evaluated within the actual Power Query editor.
Not only that but within the Dataflow Gen2 experience, after enabling the input widgets through the Options menu, you will also have a new way that simplifies how you can reference variables with a complete no code experience fully integrated into the experiences and dialogs that you love from Dataflow Gen2:
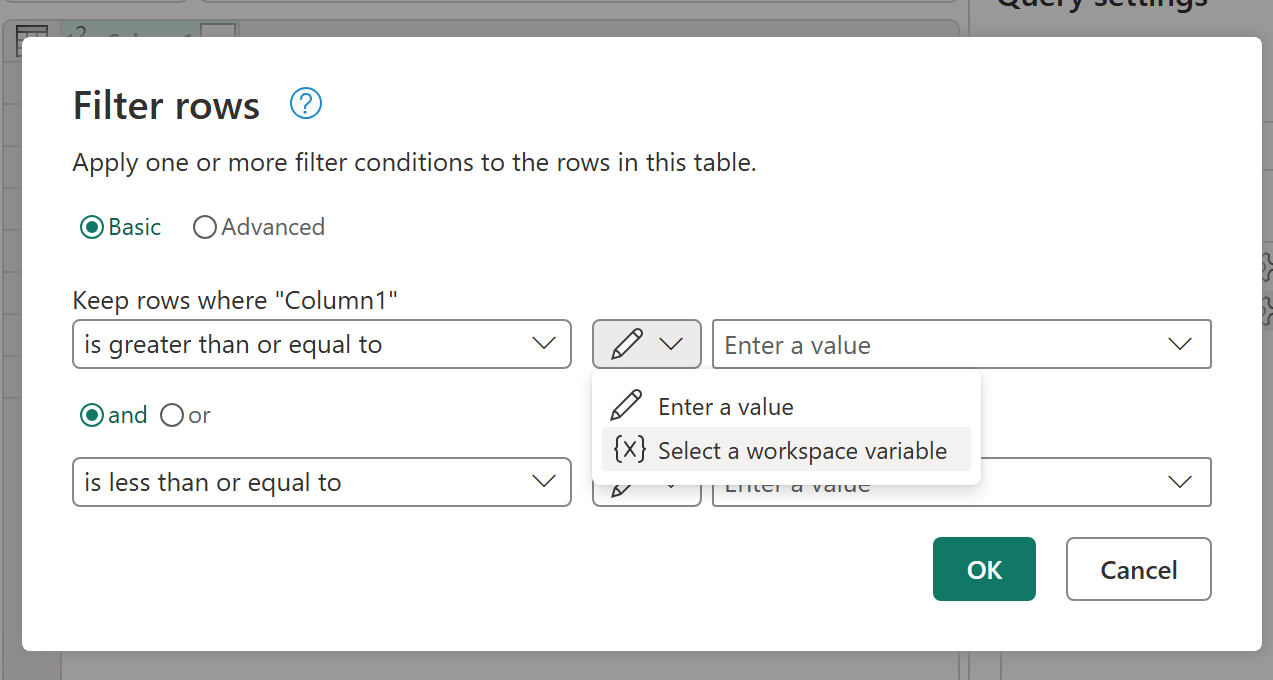
Figure: The Filter rows dialog within Dataflow Gen2 showing the input widget and the option to Select a workspace variable
After selecting this option in any of the dialogs, the experience of selecting a Variable from a library will appear.
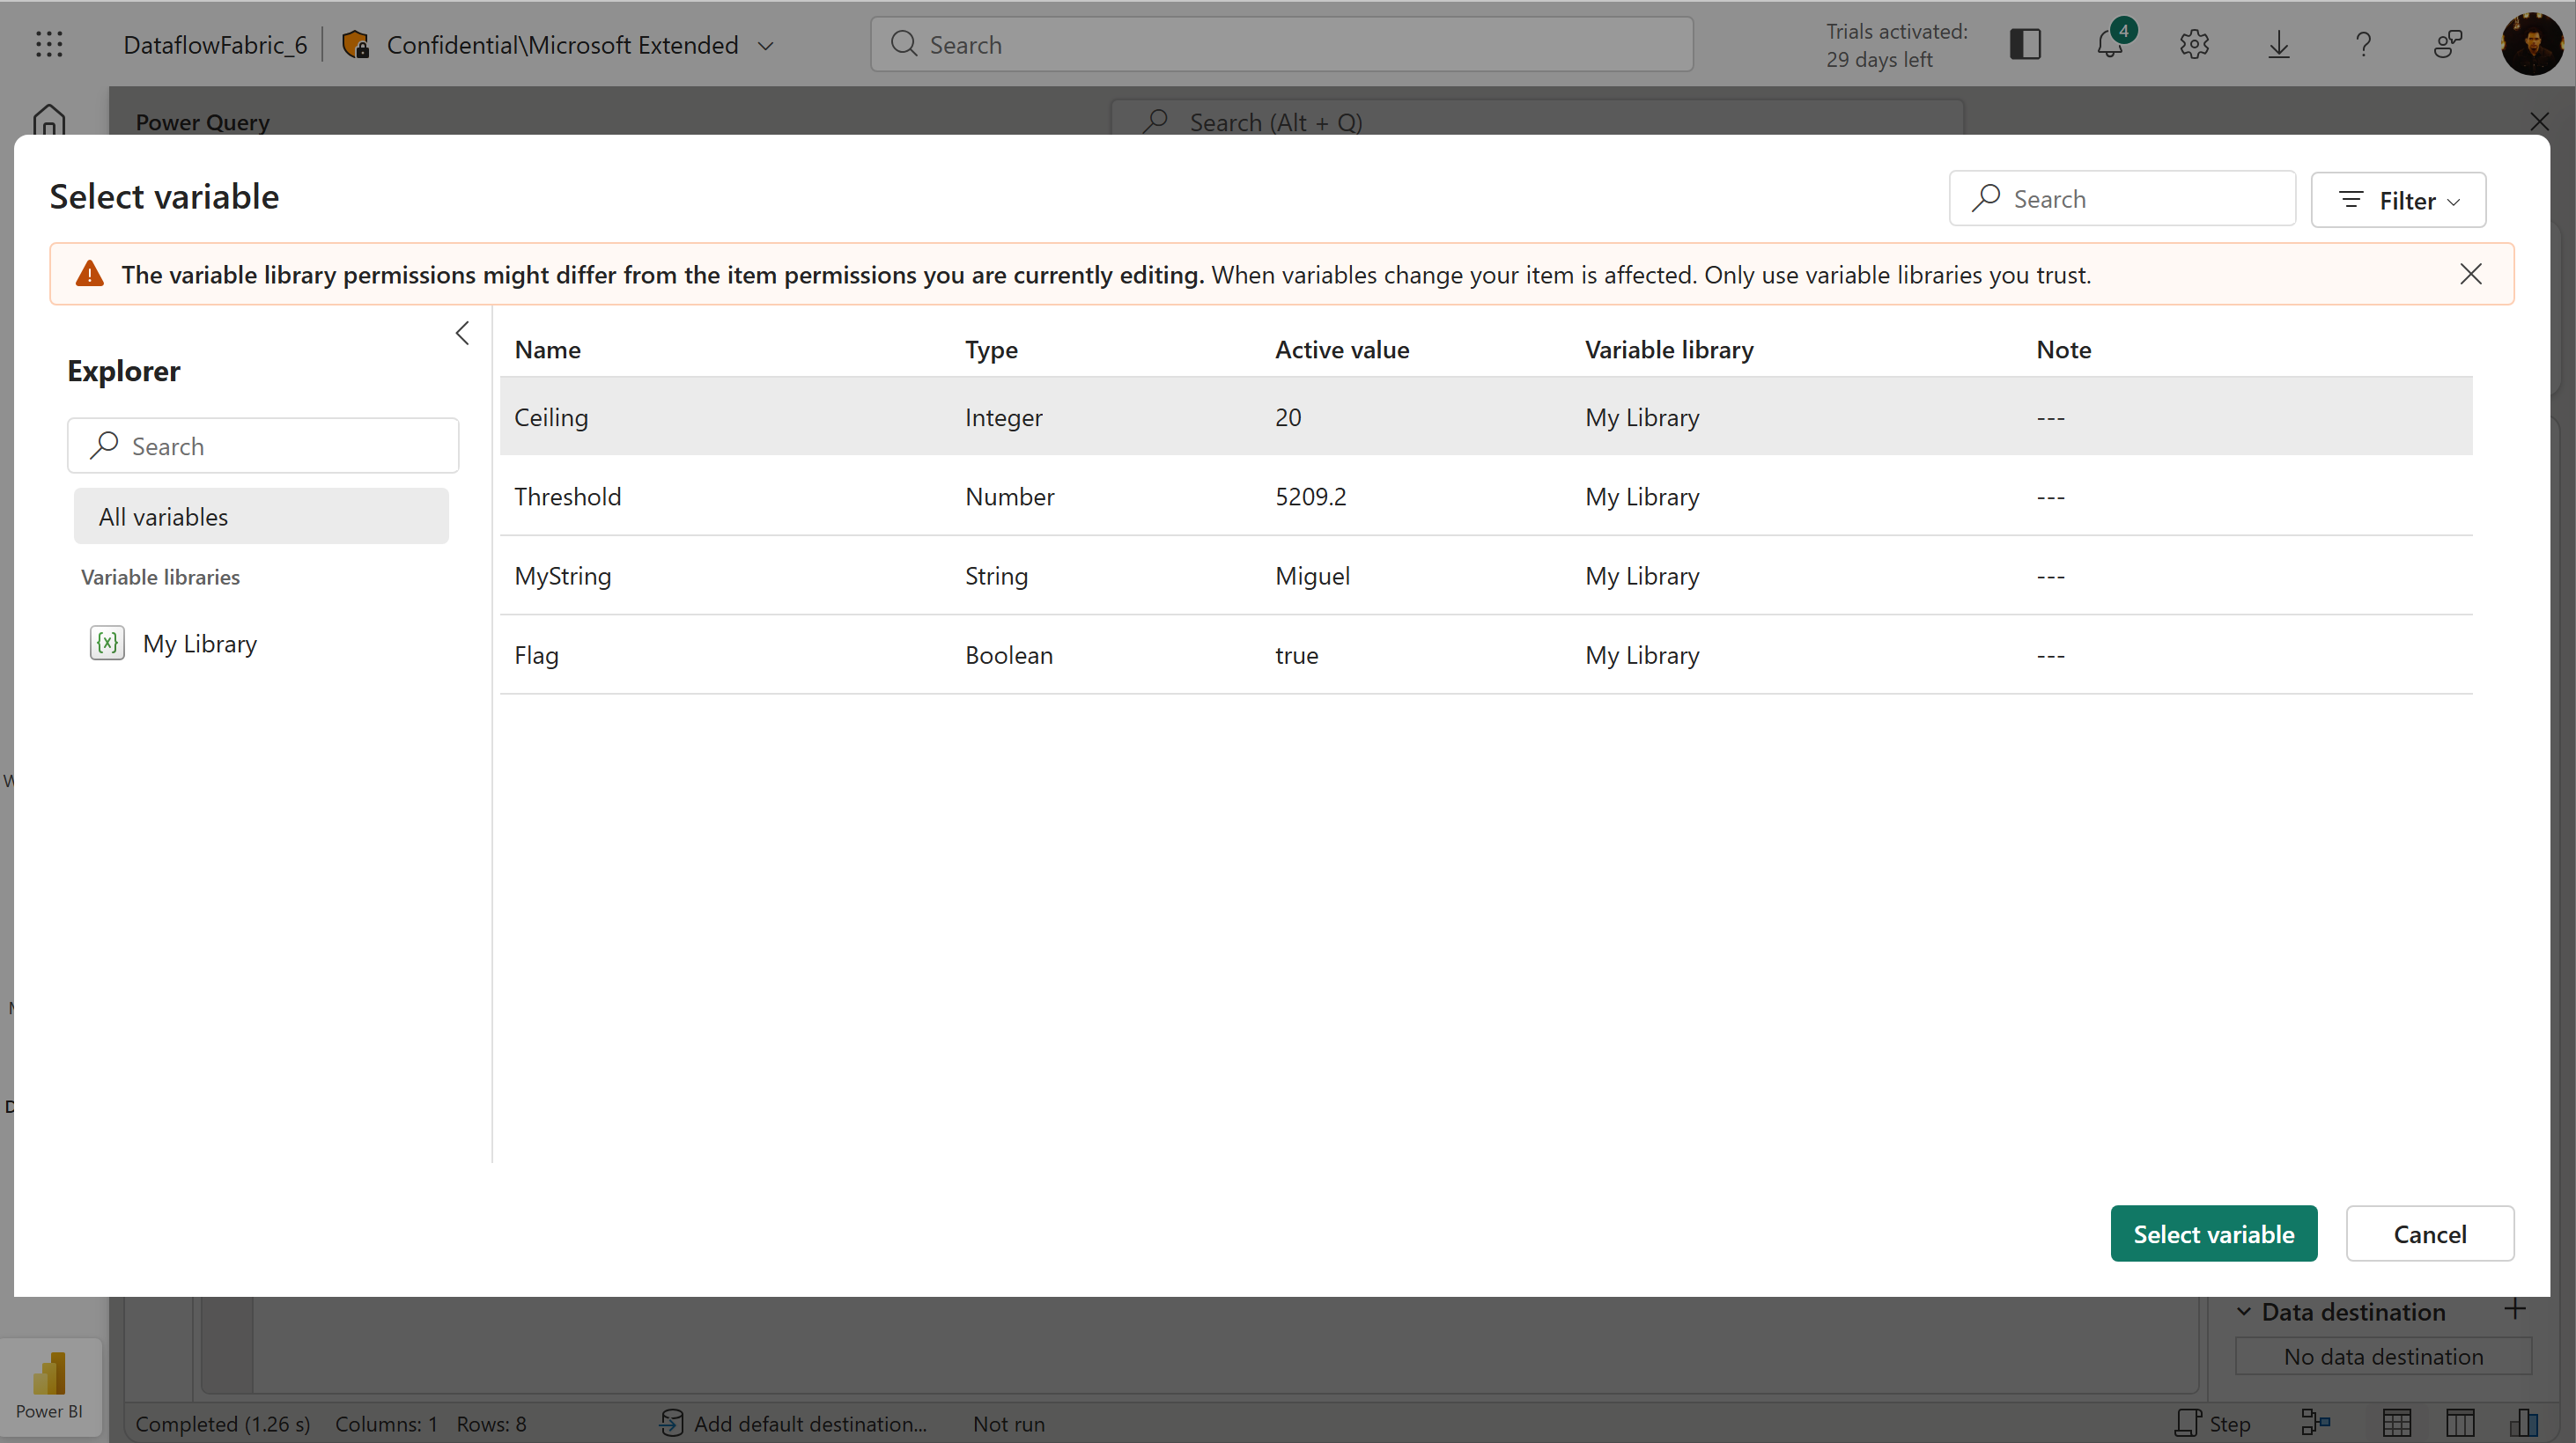
Figure: The select variable dialog invoked from within a Dataflow Gen2
Be sure to test this improved experience and share your feedback.
Learn more: Use Fabric variable libraries in Dataflow Gen2 (Preview) – Microsoft Fabric
New data destinations
Dataflow Gen2 continues to expand where curated data can land, supporting both lake‑first architectures and hybrid data estates. With new and updated destinations, teams can publish transformed outputs in the formats and platforms that best fit their downstream consumers—whether that’s open lake storage, lakehouse files, enterprise warehouses, or business‑friendly file formats.
Azure Data Lake Storage Gen2 (Generally Available)
Dataflow Gen2 now supports Azure Data Lake Storage Gen2 (ADLS Gen2) allowing teams to land curated outputs directly into their data lake using open formats and folder structures aligned to organizational standards. This enables lake‑first ingestion patterns for organizations that treat ADLS as their system of record, while still authoring transformations using low‑code Dataflow Gen2 experiences.
Common scenarios include reusing curated outputs across Fabric (Spark and SQL) as well as external systems that are read directly from Azure Data Lake Storage Gen2.

Figure: ADLS gen2 destination option
Lakehouse files (Generally Available)
Dataflow Gen2 can write outputs directly into the Files area of a Fabric lakehouse. This is useful when downstream consumers expect file‑based outputs rather than tables, or when teams need to align with existing folder and file conventions inside the lakehouse.
This enables patterns where transformed extracts are consumed by Spark notebooks, pipelines, or external tools, while also supporting hybrid designs where some Dataflow outputs are tables and others are files within the same Fabric workspace.
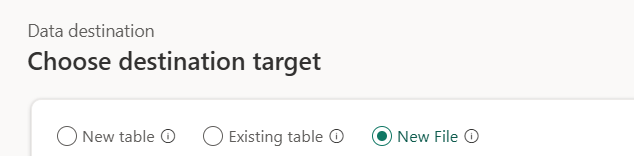
Figure: Lakehouse files option
Snowflake databases (Preview)
This enables transformed outputs to be published directly into Snowflake databases as part of Fabric‑based, low‑code transformation workflows. This supports hybrid data estates where Fabric is used for transformation while Snowflake remains the target platform for analytics or data sharing.
This preview helps standardize transformations across platforms and enables analysts to departments to publish governed outputs into Snowflake without duplicating transformation logic.
Figure: Snowflake destination option
Excel files (Preview)
Dataflow Gen2 is introducing the ability to write outputs as Excel files (Preview) for supported filesystem destinations such as SharePoint and ADLS Gen2. This makes it easier to support business processes that still rely on Excel, while keeping transformation logic centralized and governed in Fabric.
Typical scenarios include publishing refreshed Excel extracts for operational reporting or legacy workflows, and standardizing Excel output formatting from a single Dataflow definition.
Schema support in Fabric data destinations (Generally Available)
As Dataflow Gen2 adoption grows, many teams run into organizational challenges when publishing tables into shared destinations. Without schema control, teams often resort to creating separate databases, warehouses, or lakehouses just to keep tables logically grouped—adding complexity and making collaboration harder.
With this release, Dataflow Gen2 data destinations now support writing into specific schemas (where applicable). This capability is now generally available for destinations such as Fabric SQL databases, Lakehouses, and Warehouses, giving teams more control over how Dataflow outputs are structured and governed.
What’s improved
- Better organization without extra destinations: Teams can organize tables by domain—such as finance, sales, or HR—using schemas instead of creating separate destinations for each area. This keeps environments cleaner while still enforcing logical separation.
- Smoother collaboration in shared environments: Multiple teams can publish tables into the same warehouse or SQL database while maintaining clear ownership and structure through schemas. This reduces naming conflicts and supports shared analytics models without friction.
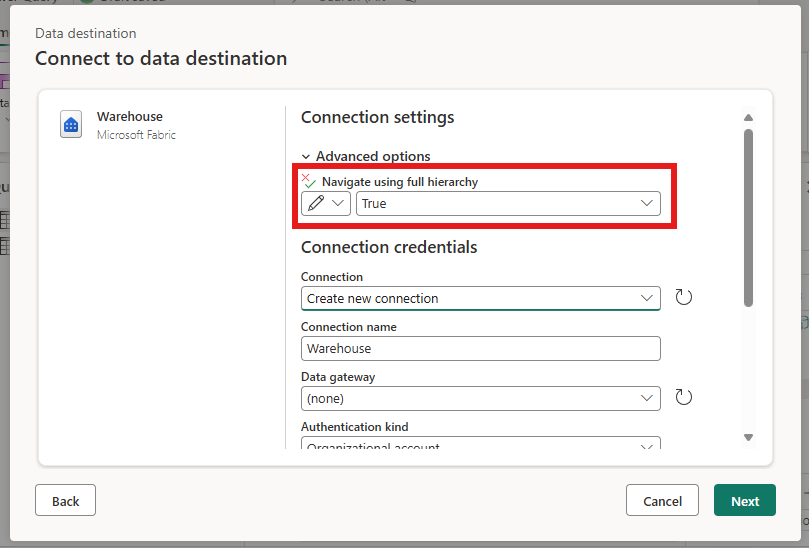
Figure: The connection settings for the Warehouse connector using the advanced options to set the Navigate using full hierarchy to true
By aligning Dataflow Gen2 outputs with enterprise schema conventions, this enhancement makes it easier to support multiteam data platforms, improve governance, and scale Dataflow Gen2 usage across the organization without restructuring existing destinations.
Learn more: Dataflow Gen2 data destinations and managed settings – Microsoft Fabric
AI-Powered Prompt Transform (Generally Available)
Fabric AI Prompt is integrating generative AI features into the low-code data transformation process. Authors can enrich and transform data using natural language prompts without building or managing machine learning models, while staying within the Dataflow Gen2 execution model.
The AI Prompt capability is accessed from the Add column experience, where authors define a prompt and select columns to provide contextual input. This allows AI-driven enrichment to be expressed inline alongside existing Power Query transformations, keeping logic centralized and auditable.
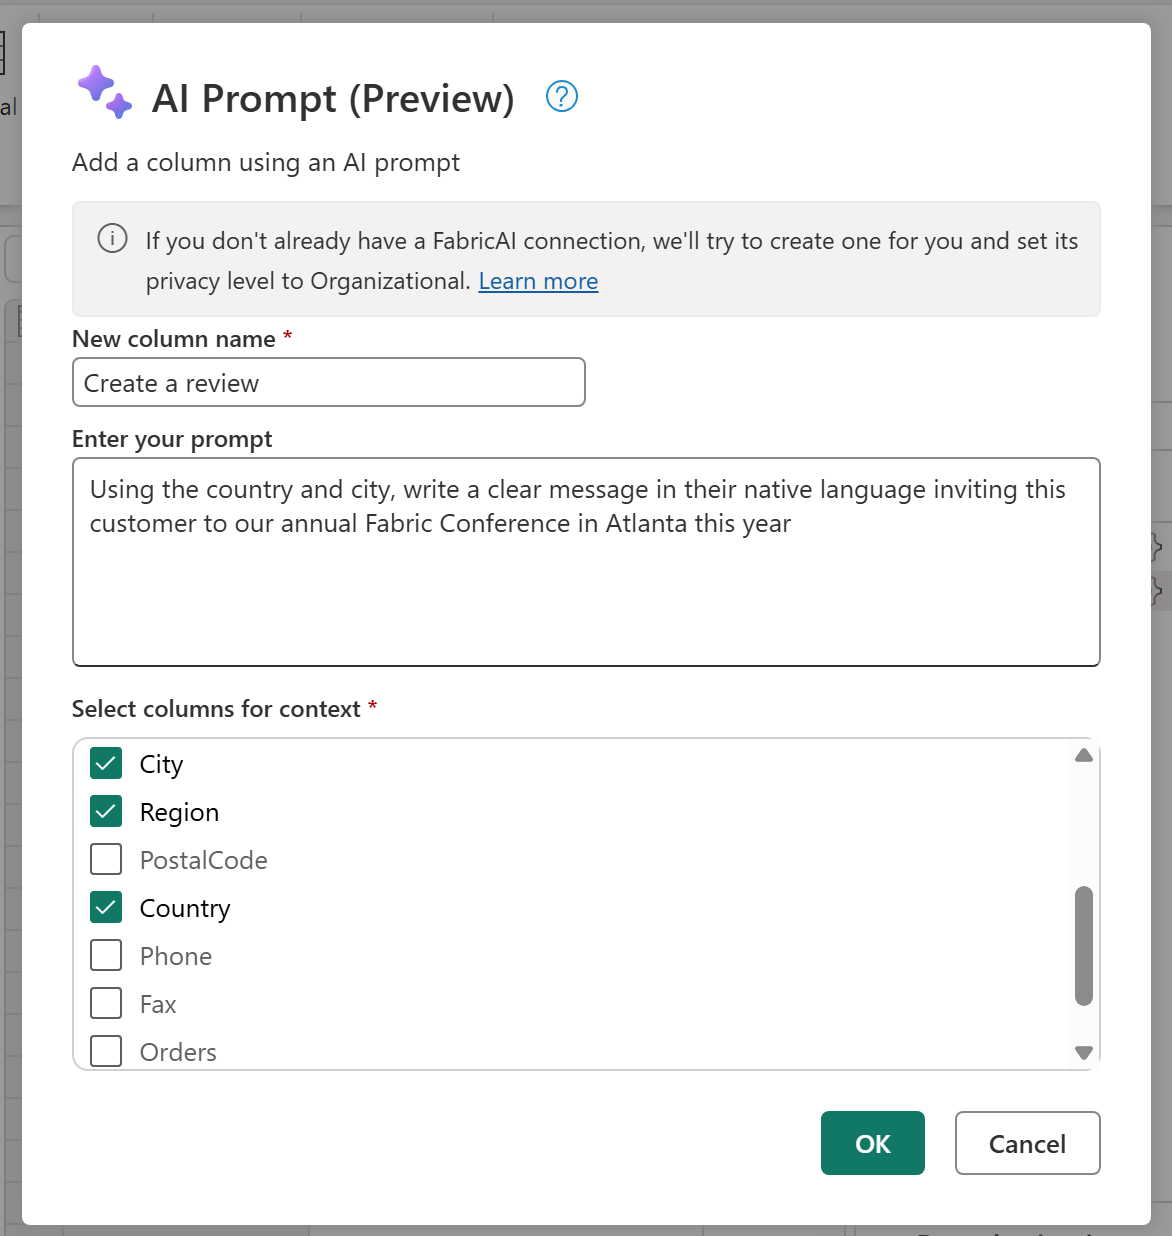
Figure: The AI Prompt dialog in Dataflow Gen2
Moving forward, all operations associated to the usage of AI Prompt within Dataflow Gen2 will be accounted towards an explicit AI meter with the operation name of “AI Functions”.
Learn more: Fabric AI Prompt in Dataflow Gen2 (Preview) – Microsoft Fabric
Publish experience UX + performance improvements (parallelized query validations)
Publishing complex Dataflow Gen2 items can be time‑consuming, especially when dataflows contain many queries or multiple destinations. In these cases, validations are required before a dataflow can be published, and waiting for those checks to complete often slows down iteration and troubleshooting.
With this release, we’ve improved the Dataflow Gen2 publish experience through a refreshed user interface and performance enhancements that parallelize query validations. By running validations concurrently, publish operations complete faster and surface issues earlier in the process.
What’s improved
- Less time waiting: Dataflows with multiple queries and destinations publish faster, reducing idle time during validation and helping teams move through development and testing more efficiently.
- Clearer guidance during publication: Validation results are available sooner, making it easier to identify and resolve issues without repeated publish attempts or back‑and‑forth edits.
Together, these improvements shorten the publish cycle, reduce friction when working with larger dataflows, and help teams iterate on Dataflow Gen2 solutions with more predictable and responsive feedback.
Learn more: Dataflow Gen2 with CI/CD and Git integration.
Save As Improvements: Scheduled Refresh Policies and Public APIs
Save As continues to improve the migration experience to Dataflow Gen2 (CICD), especially for teams moving large numbers of dataflows across workspaces or tenants. One common challenge during migration is preserving refresh behavior—copied dataflows often require manual reconfiguration before they are production ready.
With this release, Save As now supports Scheduled Refresh Policies for Dataflows Gen1, ensuring that refresh configurations are retained when copying a dataflow. This reduces post migration cleanup and helps teams move faster with fewer manual steps.
In addition, we’re introducing a new public Save As API for Dataflows Gen1 designed for automation and bulk operations. This enables organizations to programmatically copy dataflows at scale, making it easier to support structured migration plans and repeatable rollout processes.
What’s improved
- Streamlined refresh configurations: Dataflows created using Save As can now inherit scheduled refresh policies from the source dataflow, helping ensure consistent refresh behavior without re‑authoring schedules after migration.
- Automation at scale: The new Save As public API enables automated and bulk copy scenarios, allowing teams to migrate many Gen1 dataflows to Gen2 programmatically. This is particularly useful for multi‑workspace and multi‑tenant deployments where manual migration isn’t practical.
Together, these enhancements reduce migration friction, minimize manual edits, and help teams adopt Dataflow Gen2 more efficiently—whether migrating a handful of dataflows or rolling out Gen2 at enterprise scale.
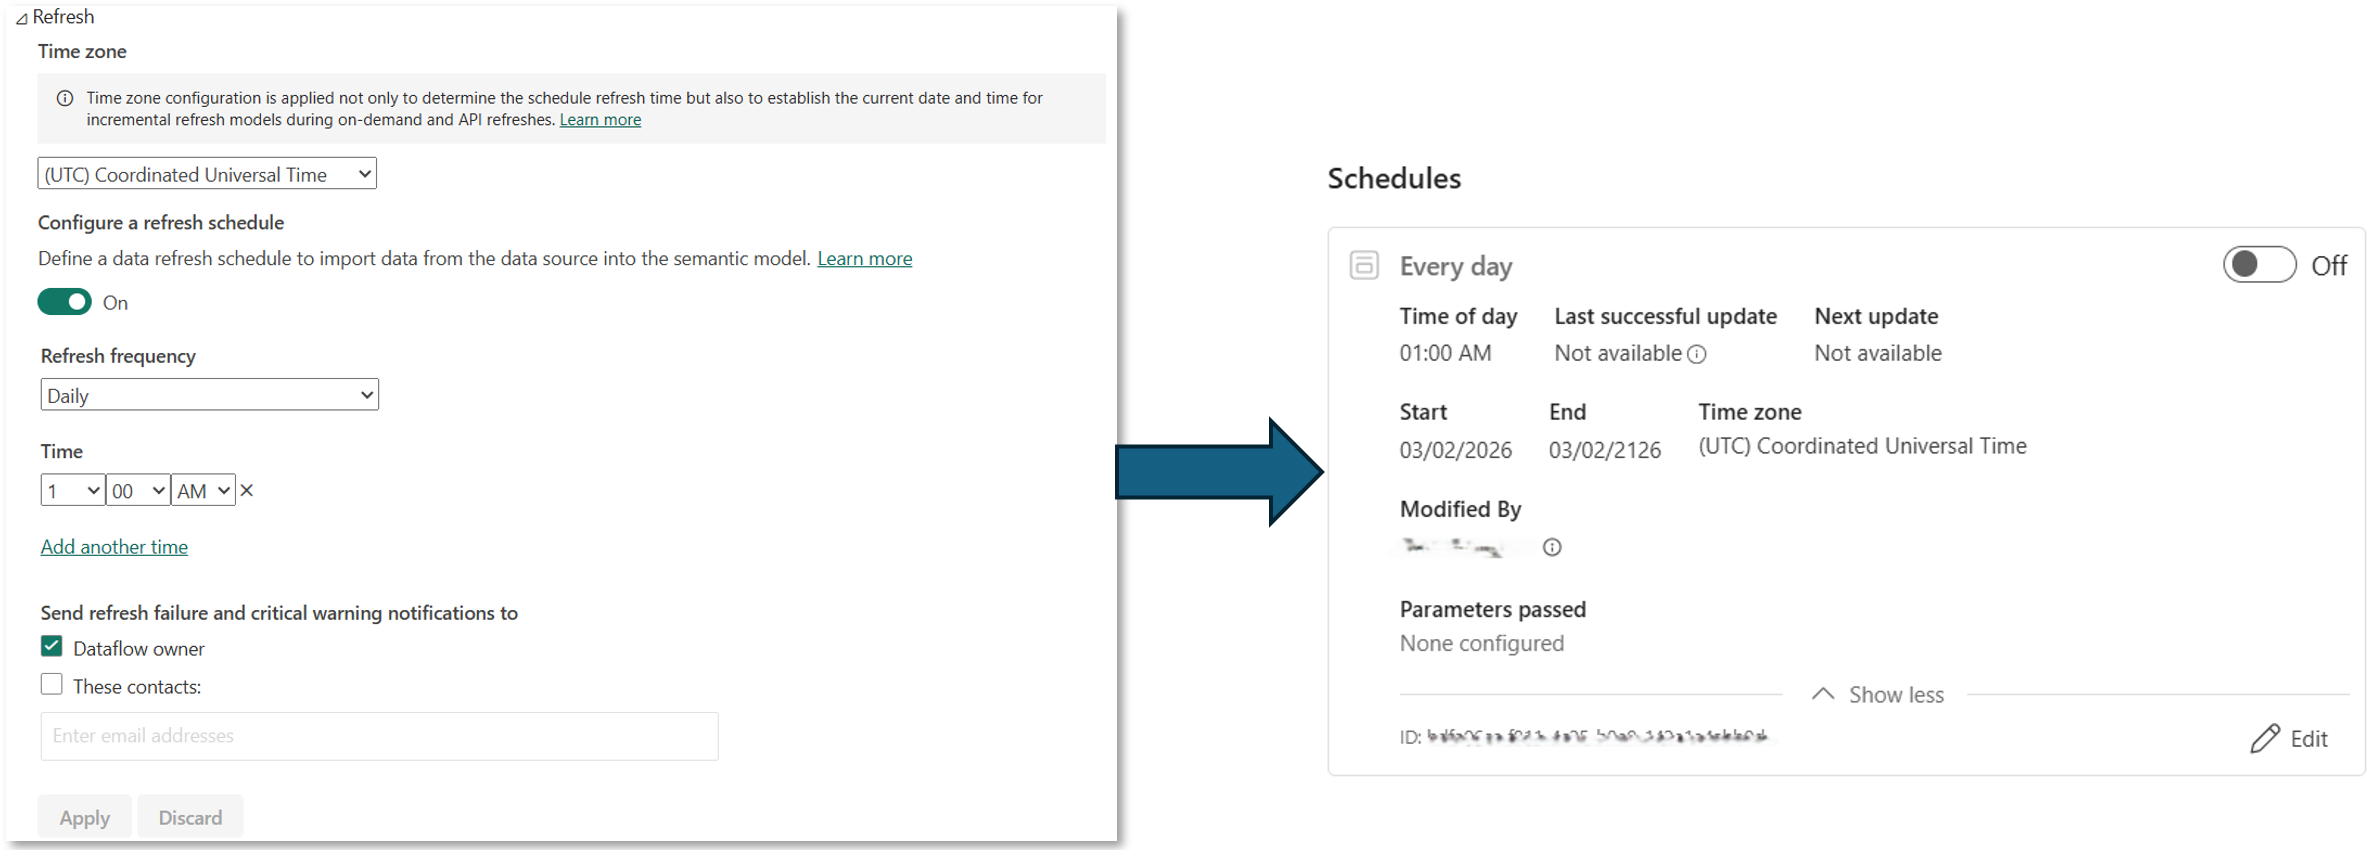
Figure: Dialogs for the refresh and scheduling mechanism when using the Save as experience for Dataflow Gen2
Learn more: Save As Dataflow Gen2 documentation and public Save As API reference.
SharePoint site picker in Modern Get Data and Data destinations (Preview)
SharePoint Site Picker replaces manual URL entry with a browsable dropdown, so you can select the right SharePoint site directly instead of finding and pasting URLs
Why this matters
- Eliminates manual URL copy-and-paste and context switching.
- Reduces connection errors caused by wrong URL formats.
- Surfaces Recent sites and Favorite sites instantly on dropdown open and enable you to search to find sites.
Where the experience is available
SharePoint site picker is available for SharePoint sources of Get Data in Dataflow Gen2, Pipelines, Copy Job, and Lakehouse shortcuts, and as a destination in Dataflow Gen2.
How to use SharePoint Site Picker
Simplified SharePoint Site Selection: Instead of copying URLs manually, use the Site URL dropdown to choose from Recent sites and Favorite sites.
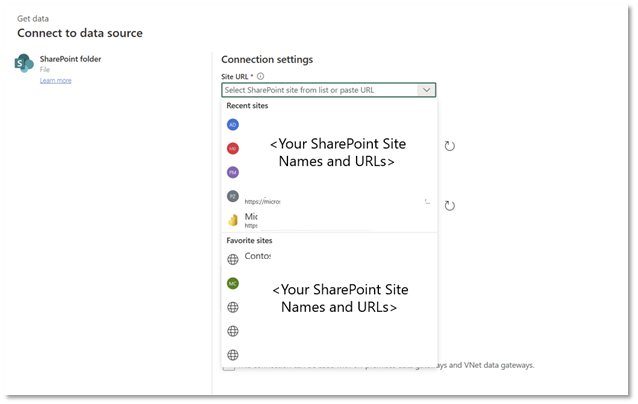
Figure: SharePoint Site Picker dropdown
Quick Search Capability: Find related sites faster by typing in the dropdown search box. Once you select a site, you can load data into the Power Query editor for transformation.
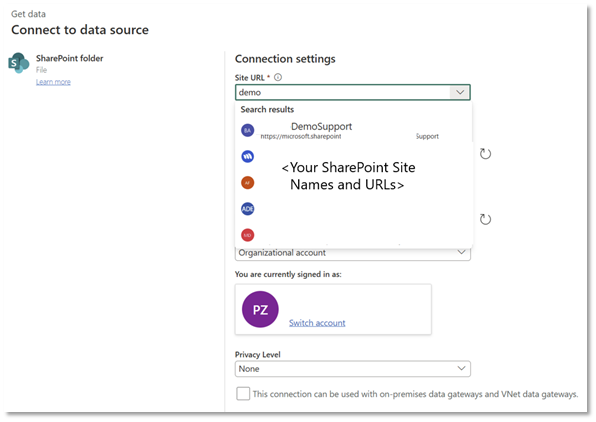
Figure: SharePoint Site Picker searched for results
Learn more about SharePoint folder connector, SharePoint list connector, and SharePoint online list.
Diagnostics download (Preview)
Dataflow Gen2 diagnostics download provides a simple way to collect logs and diagnostic artifacts for both cloud-based and VNET gateway dataflows. Instead of rerunning refreshes or guessing at failures, you can download the information needed to investigate issues directly.
This helps teams fail faster and fix issues sooner. Downloadable diagnostics make it easier to identify refresh failures, performance bottlenecks, and connectivity problems, including complex networking scenarios that rely on VNET data gateways.
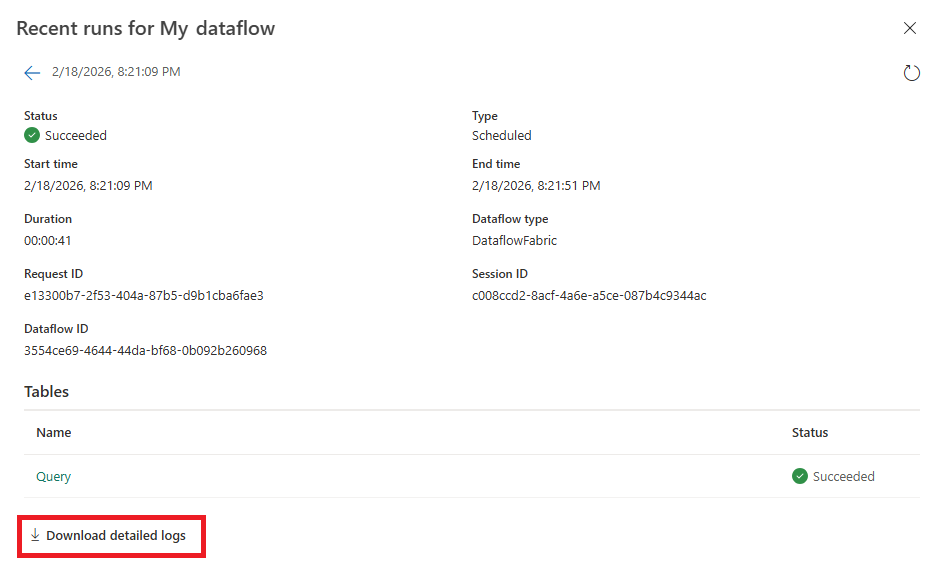
Figure: The recent runs dialog showing the new button at the bottom left of the dialog to Download detailed logs
With clearer signals available upfront, support investigations are shorter and operational friction is reduced.
Learn more: An overview of refresh history and monitoring for dataflows.
Advanced Edit for destinations (Preview)
The new Advanced Edit experience for Data Destinations enables editing of the underlying M logic that configures destination settings. This unlocks deeper customization, including the ability to leverage parameters to drive destination behavior—an important step for teams standardizing deployments across environments.
- Parameter-driven destinations: switch target schema/table, file paths, or naming conventions without rewriting queries.
- Unblock advanced scenarios that require destination settings not yet available in the simplified UI.
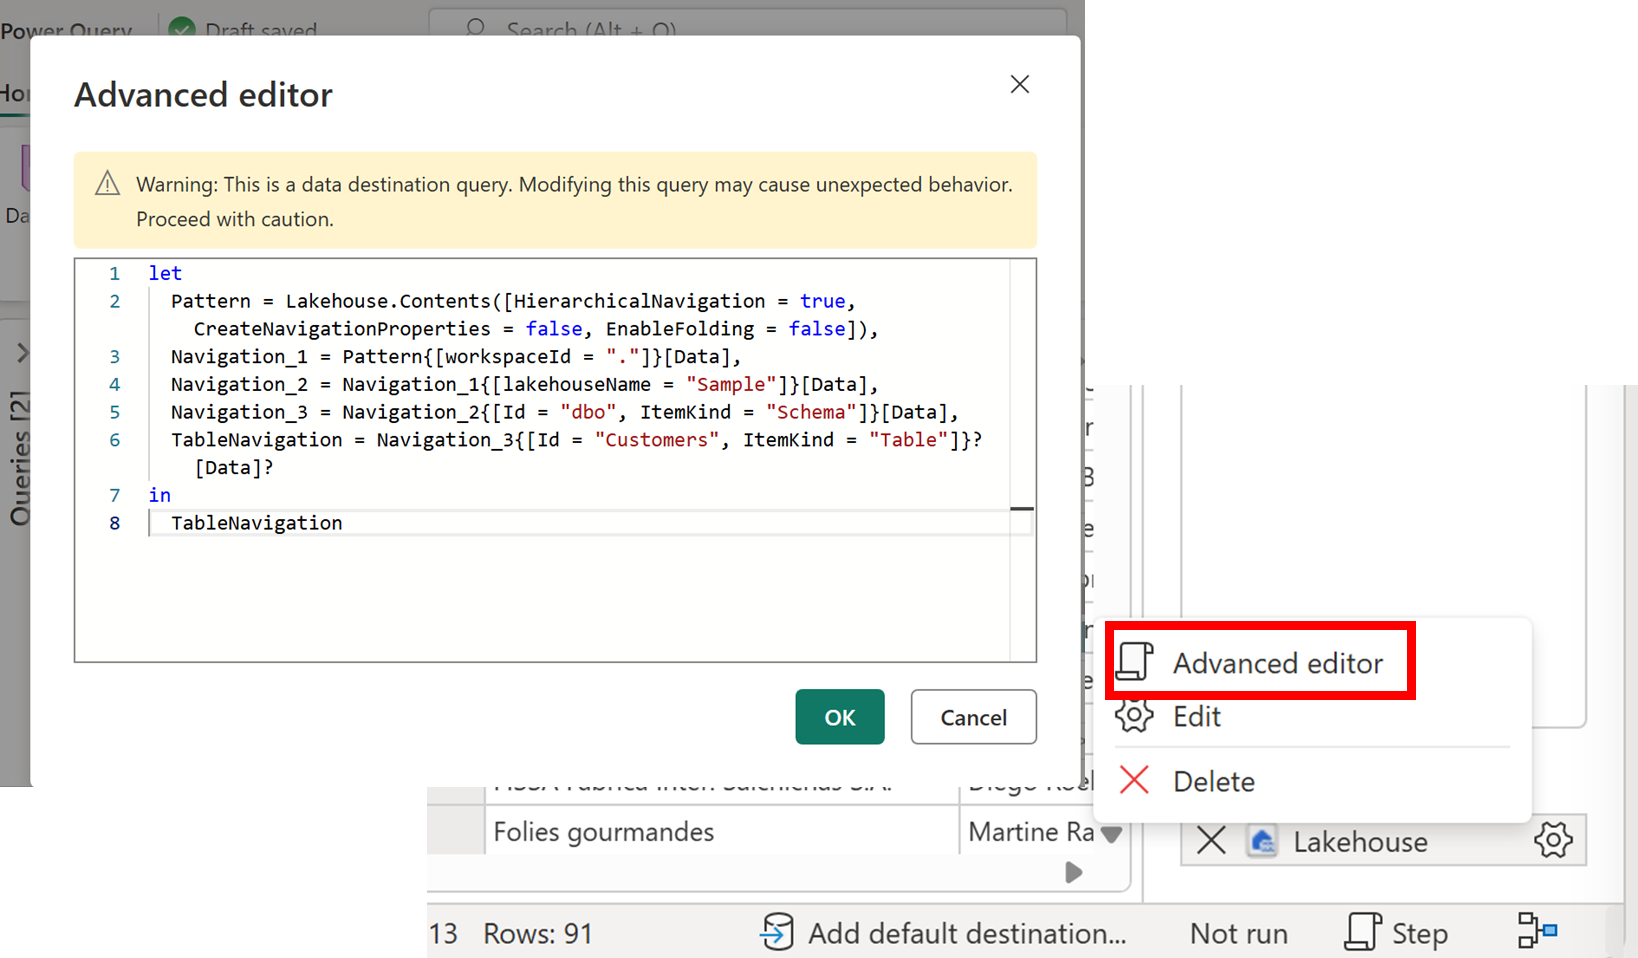
Figure: The new Advanced editor for data destinations
Learn more: Advanced edit for data destination queries in Dataflow Gen2 – Microsoft Fabric.
Data destination validations during publish (Preview)
Dataflow Gen2 now validates data destinations during publication, helping catch common issues earlier in the development cycle. These validations surface problems such as missing permissions, invalid destination settings, or naming conflicts before the first refresh runs.
By shifting these checks to publish time, authors get clear, actionable errors sooner—when changes are easiest to fix. This shortens the feedback loop and reduces time spent troubleshooting runtime refresh failures after deployment.
For creators, earlier validation means fewer broken dataflows entering production. This reduces operational noise, minimizes rework, and helps ensure that published dataflows are refresh ready and more stable by default.
Learn more: Dataflow Gen2 data destinations validation rules.
Evaluate query API (Preview)
The Execute Query API (Preview) enables on-demand execution of Power Query logic in Dataflow Gen2 scenarios—without requiring a full scheduled refresh cycle. It’s designed for cases where you need to trigger transformations programmatically (or in response to events) and retrieve results quickly for downstream processing.
- Event-driven pipelines: run a transformation when new data arrives and push outputs to a destination or consumer immediately.
- Streaming and near-real-time scenarios: execute queries more frequently than a typical scheduled refresh to support operational dashboards and alerting workflows.
- Automation at scale: integrate with orchestration tools and scripts to run specific queries as part of broader ETL/ELT jobs.
- Faster debugging: re-run targeted queries to validate fixes without republishing the entire dataflow.
Learn more: Execute Query API (Streaming) documentation (Preview).
Data Factory
Data Factory MCP (Preview)
Dataflow Gen2 offers a suite of pipeline functions, including dataflow creation, M (Power Query) scripting, connection management, query execution, and refresh coordination. These tools are directly accessible to AI assistants. Access is available through platforms such as VS Code, Claude, ChatGPT, Gemini, or via the command line.
Why it matters
- AI assistants create, test, and deploy dataflows through natural language—no browser tabs or manual configuration required.
- Iterative M development via execute_query lets the AI test transforms against live data before committing to a full refresh.
- MCP Apps provide guided UI forms (connection setup, gateway selection) inside the chat panel.
- Open source (GitHub), ships as a NuGet package, runs locally—credentials never leave your machine.
Learn more: Data Factory GitHub repo.
IBM Netezza ODBC Driver (Generally Available)
As we move away from using the embedded Simba driver, customers now have a more dependable and supported option by using their own Netezza driver.
This update ensures continued connectivity, long-term support, and a more future-ready experience for organizations using the Netezza connector.
Customers do not need to install the new connector; you may reuse your existing connector but will need to install the new IBM Netezza ODBC driver.
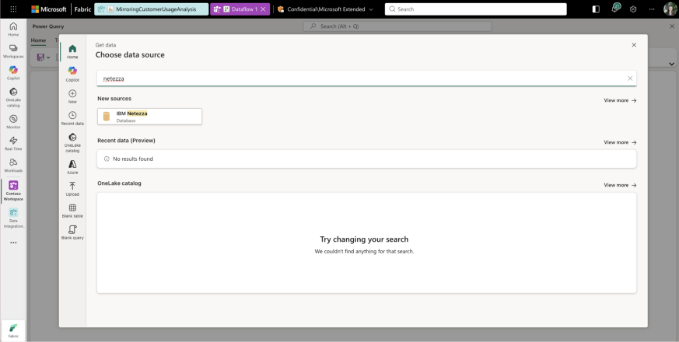
Figure: IBM Netezza Connector Selection in Fabric UI
Reference the IBM Netezza ODBC documentation for more information
Google BigQuery connector (Generally Available)
This update reflects a shift to the newer GBQ connector as the supported, long-term path forward, providing customers with improved reliability, and alignment with our evolving security standards.
With this update, customers can use a connector designed for durability, compliance, and future enhancements.
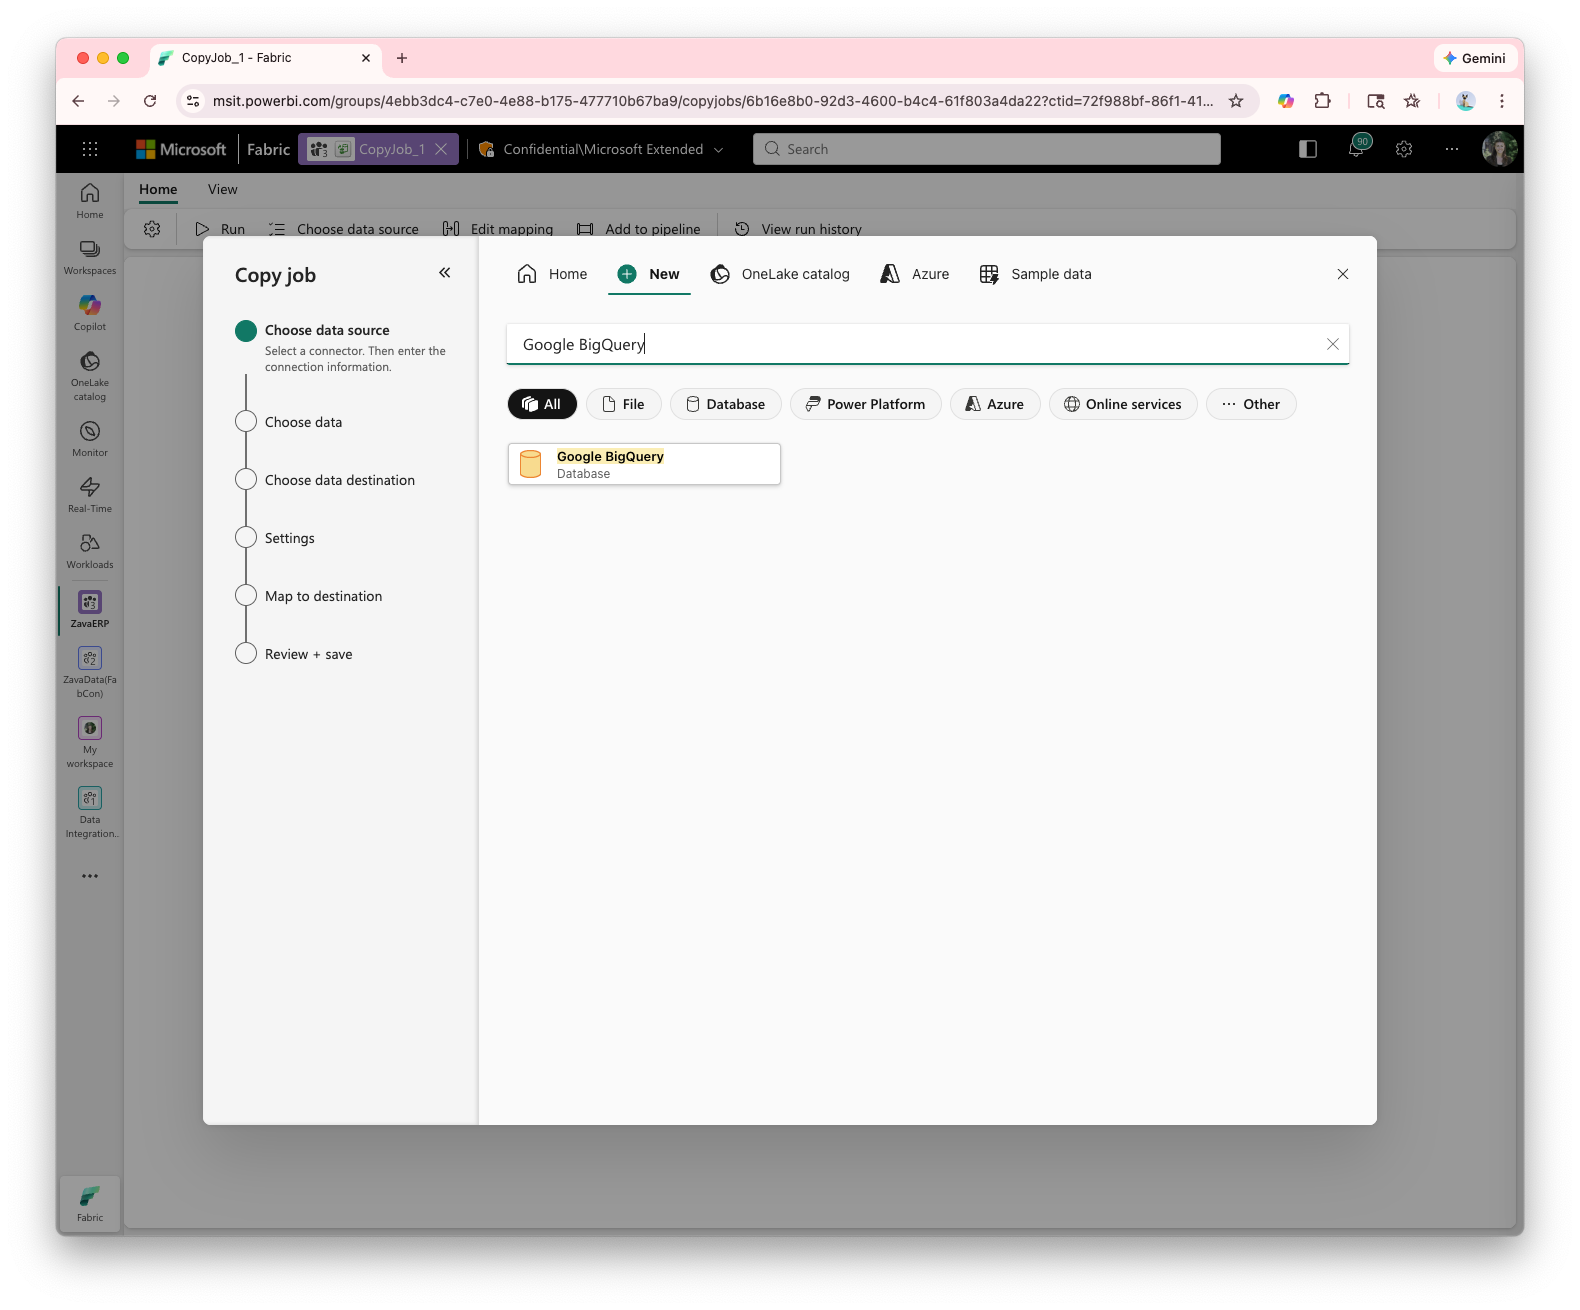
Figure: Google BigQuery Connector in Fabric UI
Additional details are available in the Google BigQuery connector documentation.
QuickBooks Online connector retirement
The QuickBooks Online connector is being retired and will no longer be supported as of March 2026.
As part of our ongoing platform evolution, this change streamlines our connector portfolio and ensures our continued commitment to only the highest level of secure data connectivity.
After retirement, customers will no longer be able to create new connections, and existing connections may no longer function.
Lakehouse Maintenance activity in Fabric Pipelines (Preview)
Keeping your Lakehouse healthy shouldn’t require a long checklist or manual scripts. The new Lakehouse Maintenance activity (Preview) makes it easy to automate common upkeep tasks directly inside Fabric Data Factory pipelines.
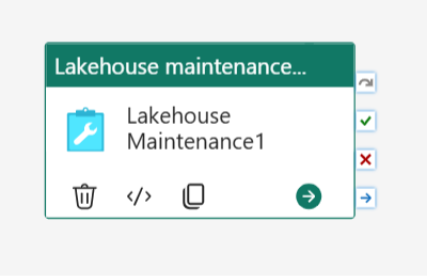
Figure: The Lakehouse maintenance activity in Fabric pipelines
With this activity, you can schedule and run actions like vacuuming old files, optimizing table layouts, and managing storage—all in a repeatable, governed workflow. It’s a simple way to keep performance high and storage costs in check, especially for teams managing large or fast‑growing datasets.
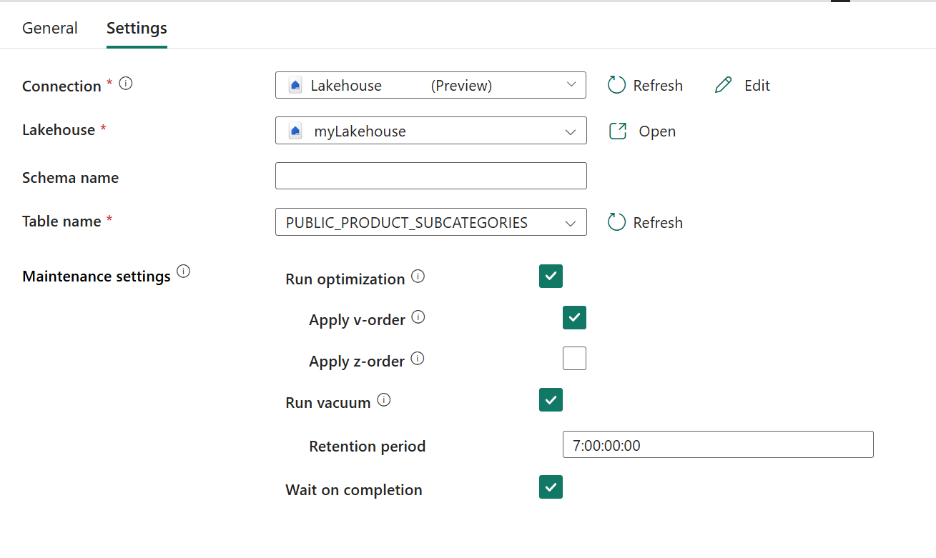
Figure: The Lakehouse maintenance activity settings
Whether you run maintenance nightly or as part of a broader DataOps process, this activity helps support reliable Lakehouse operations.
Check out our Lakehouse Maintenance documentation.
Refresh SQL endpoint activity in Fabric pipelines (Preview)
The process of keeping your SQL analytics layer current is now simpler. The new Refresh SQL endpoint activity (Preview) lets you refresh your Lakehouse SQL endpoint on-demand or as part of your pipeline orchestration.
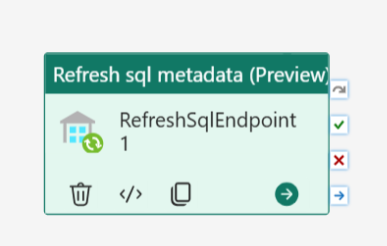
Figure: The Refresh SQL endpoint activity
You can trigger targeted refreshes after data ingestion, run coordinated refreshes alongside your transformations, or ensure downstream consumers always see the latest state. It’s built for operational consistency – especially for BI, reporting, and real‑time analytics scenarios that rely on predictable SQL performance.
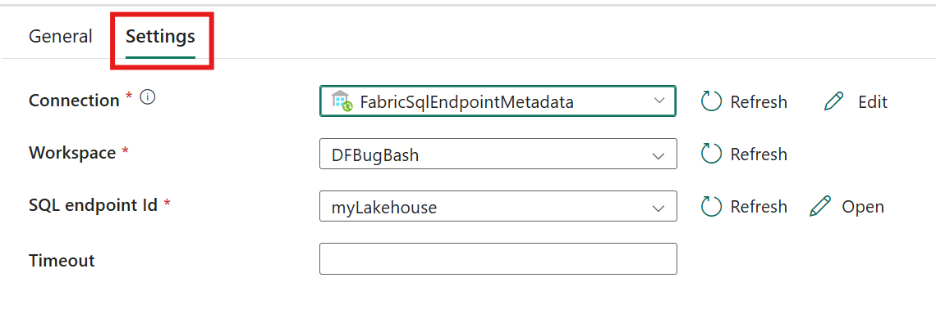 Figure: The Refresh SQL Endpoint activity settings.
This activity gives you more control, less manual overhead, and a smoother end‑to‑end refresh experience.
Check out the RSQL documentation for more details.
Generate Pipeline expressions with Copilot (Generally Available)
Writing expressions doesn’t have to be time-consuming; simply describe your needs in natural language, and Copilot will generate pipeline expressions for you.
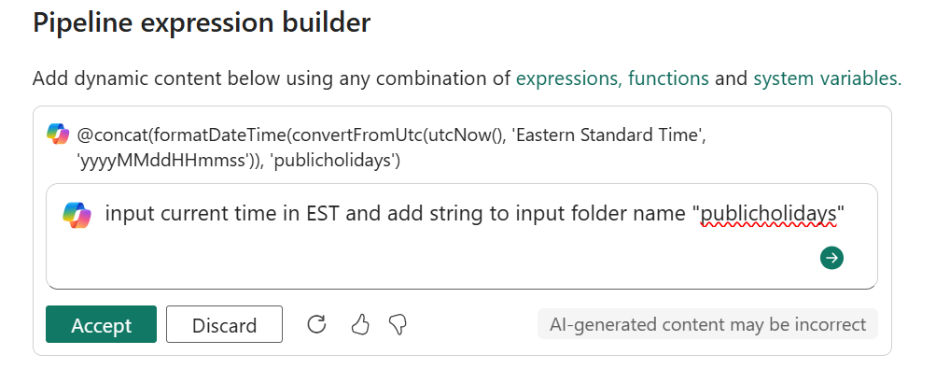 Figure: Generate Pipeline expressions with Copilot
Whether it’s building dynamic folder paths, conditional logic, string parsing, or parameterized values, Copilot now handles the expression authoring for you. This feature removes friction for both new users and power users – saving time, reducing errors, and making expression logic easier to understand.
Workspace monitoring for Fabric Data Factory’s pipelines and Copy job (Preview)
Operational observability continues to evolve in Fabric. We’re taking the first major step toward workspace‑level observability in Microsoft Fabric Data Factory. Until now, understanding how pipelines and copy jobs behave at scale often meant inspecting individual runs via Monitoring Hub. With the introduction of workspace monitoring (Preview), Data Factory begins a shift to a workspace‑wide view of operational health. The newest workspace monitoring updates bring clearer visibility and faster troubleshooting across your pipeline ecosystem.
What’s available
- A workspace-wide view of item-level runs
- Rich filtering, sorting, and drilldown
- Insight into failure patterns, duration trends, and operational health
- Faster navigation—no need to click into each pipeline
This gives DataOps teams a unified lens to understand performance and diagnose issues quickly.
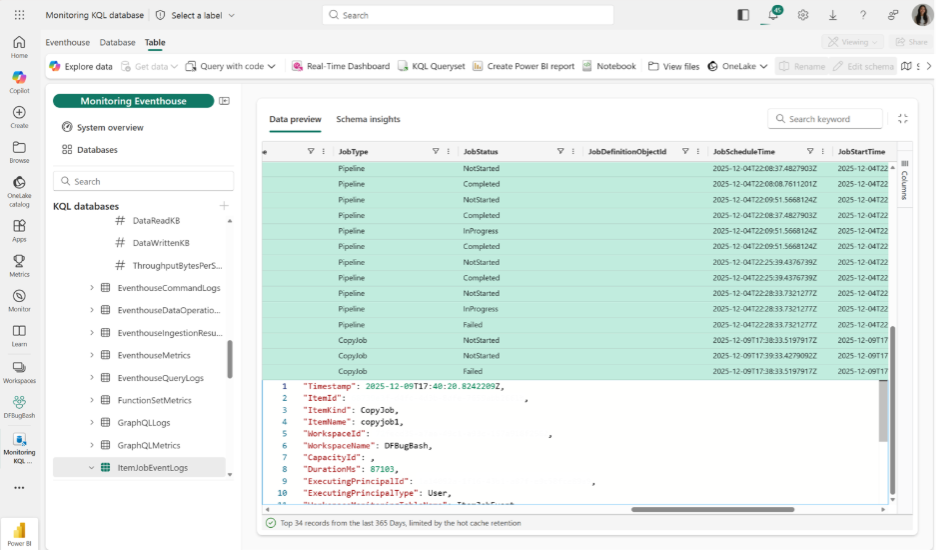 Figure: A view of your pipelines and Copy jobs within the workspace monitoring solution
Coming Soon
- Activity-level L2 monitoring for pipelines.
- Copy job L2-level monitoring (Preview) for deeper insights and debugging.
These improvements continue building toward a more comprehensive, intuitive monitoring experience for production workloads.
Check out our docs on Enable Workspace Monitoring in Microsoft Fabric and Workspace Monitoring for Copy Job in Microsoft Fabric for more information on how to use this experience.
Interval-based schedules
The latest enhancement to Fabric Data Factory pipelines is the availability of interval-based schedules! This powerful new feature allows you to automate data workflows at regular non-overlapping intervals, like the popular tumbling window trigger in Azure Data Factory.
Figure: Interval-based schedule configuration in Fabric Data Factory
With interval-based scheduling, you can easily configure recurring pipeline runs that ensure timely data processing and seamless integration across your architecture.
New Airflow APIs
New Airflow Operators
Apache Airflow jobs in Fabric Data Factory facilitate the execution of a wide range of Fabric artifacts through native operator integration. Users can run artifacts such as Notebooks, Spark job definitions, Pipelines, Semantic Models, and user data functions directly from their DAGs.
Apache Airflow jobs now provide support for executing Copy jobs and dbt jobs!
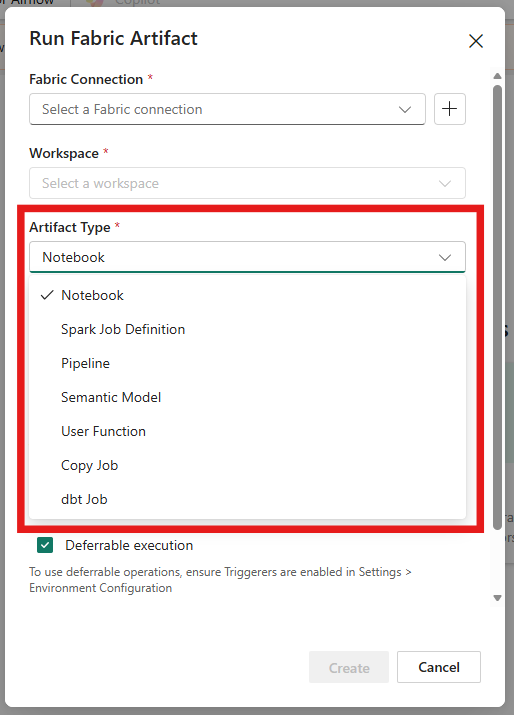
Figure: Airflow operators for Fabric items, including Copy job and dbt job execution
To learn more, refer to Run a Fabric item using Apache Airflow DAG.
PowerShell model for gateways (Generally Available)
The PowerShell model for gateways now delivers fully supported, production-ready automation for gateway lifecycle, update, restore, and configuration management. This release introduces new commands for version discovery and upgrade control, along with reliability and usability improvements that make large-scale, script-driven gateway operations easier and more robust.
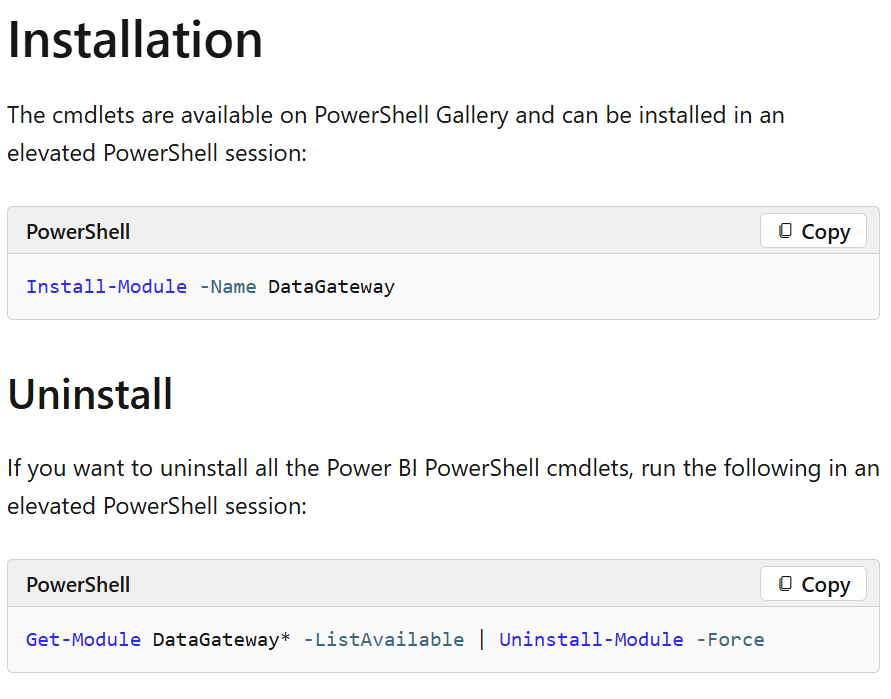
Figure: Using the Gateway PowerShell module to manage gateway operations from the command line
Learn more through the gateway PowerShell documentation and cmdlet reference on Microsoft Learn.
Certificate and proxy support for VNet data gateway (Generally Available)
Certificate and proxy support for VNet data gateway enables secure, compliant connectivity in enterprise environments. Organizations can use enterprise-issued certificates for gateway authentication and configure proxy routing when direct internet access is restricted. Together, these capabilities strengthen security, support corporate network policies, and expand deployment flexibility in controlled and regulated infrastructures.
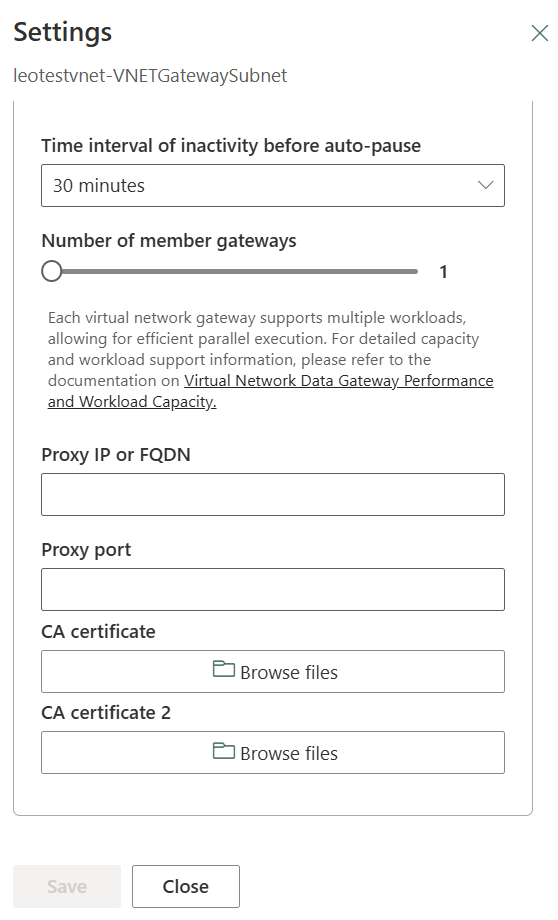
Figure: Configure certificate authentication and proxy for a Virtual Network Data Gateway
Learn more through Manage virtual network (VNet) data gateways.
Virtual network data gateway supports up to nine instances
This update enables greater scalability and higher throughput for enterprise workloads. With expanded instance capacity, organizations can handle increased data movement and processing demands, improve parallel job performance, and enhance reliability for mission-critical tasks. This update provides more flexibility to scale gateway infrastructure in line with growing business needs.
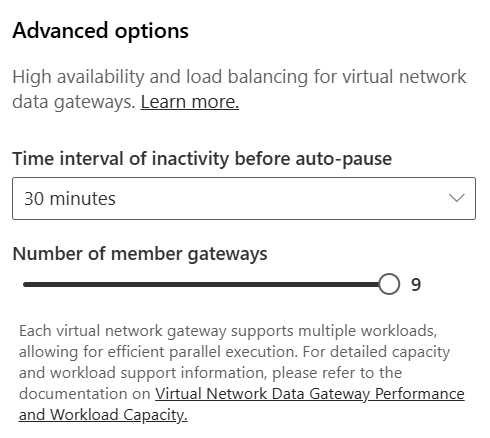
Figure: Virtual Network Data Gateway now supports scaling up to nine instances per cluster
Learn more What is a virtual network (VNet) data gateway.
SSIS Pipeline Activity (Preview)
SQL Server Integration Services (SSIS) has been a cornerstone of enterprise data integration for decades, powering mission-critical ETL workloads across thousands of organizations worldwide. Invoke SSIS Package activity in Data Factory in Microsoft Fabric (Preview), provides the power of your existing SSIS investments directly into Fabric’s unified SaaS analytics platform.
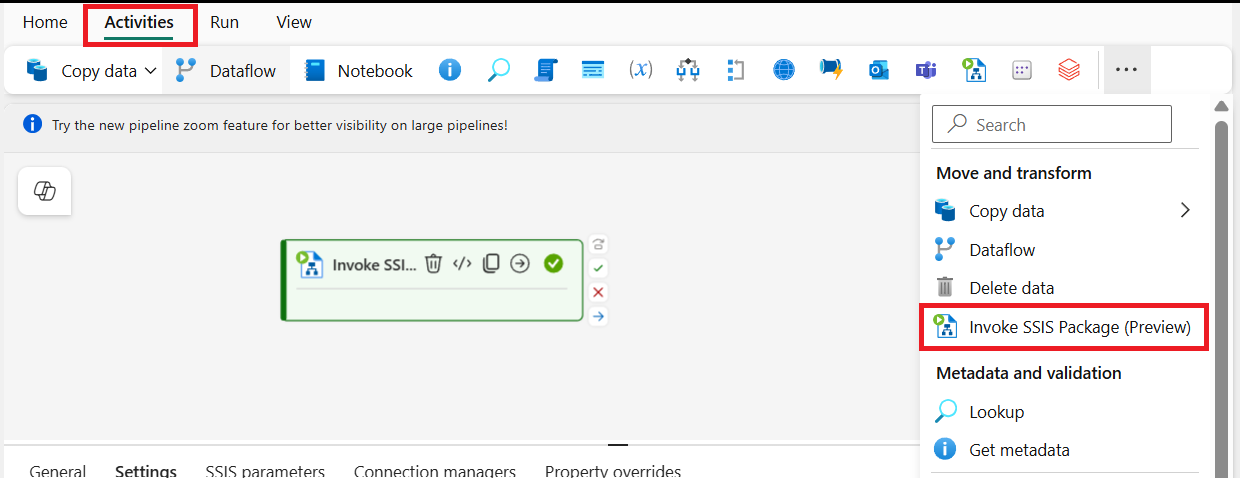
Figure: Add an Invoke SSIS Package activity
Many enterprises have significant investments in SSIS packages that orchestrate complex ETL workflows across on-premises databases, file systems, and cloud services. Until now, running these packages required either an on-premises SQL Server, or the Azure-SSIS Integration Runtime in Azure Data Factory. Both options meant managing additional infrastructure and staying outside the Fabric ecosystem.
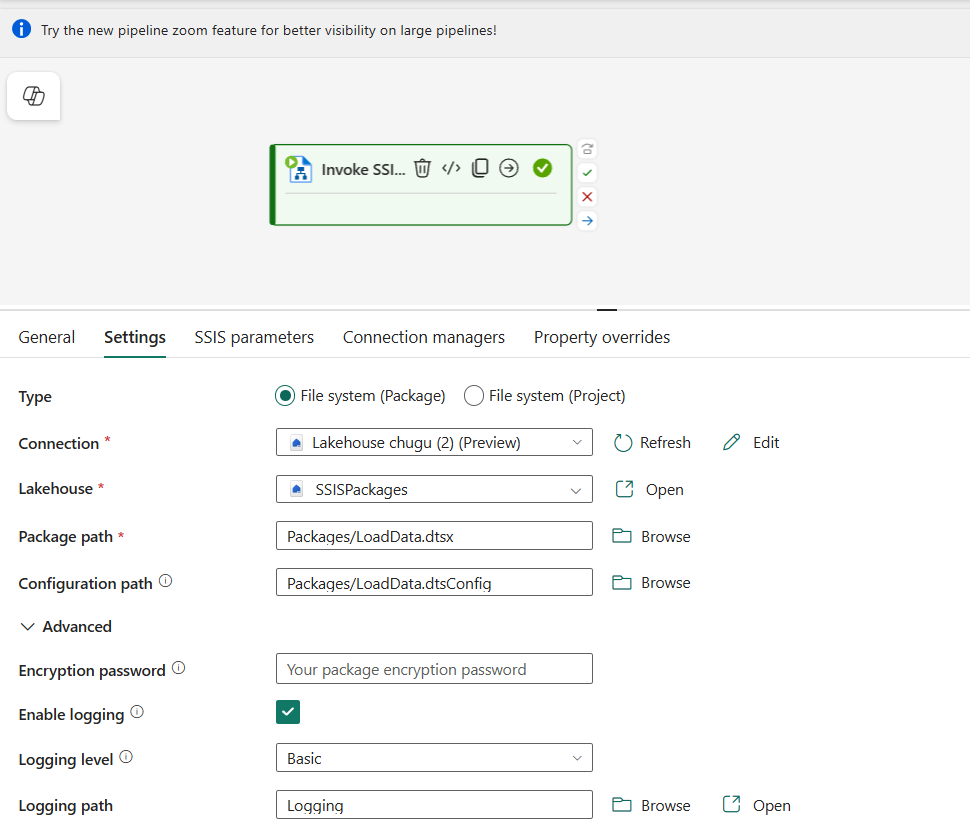
Figure: Invoke SSIS package activity configuration
But the Invoke SSIS Package pipeline activity in Microsoft Fabric Data Factory changes this. It allows you to execute your existing SSIS packages directly from a Fabric pipeline, enabling true lift-and-shift of legacy ETL workloads into Fabric—no package rewrite required. There is no need for integration of runtime management or stopping and starting IRs; simply incorporate them into your pipeline.
Seamlessly upgrade Azure Data Factory and Synapse pipelines to Microsoft Fabric (Preview)
Microsoft Fabric Data Factory now offers a guided (Preview) migration experience to help you move existing Azure Data Factory (ADF) and Azure Synapse Analytics pipelines into Fabric—starting with an assessment-first approach so you can migrate intentionally and validate before switching production workloads.
Review readiness and plan next steps:
The assessment categorizes pipelines and activities so you can decide what to migrate now vs. what to fix or defer. You can also export results to CSV for offline review and remediation planning.
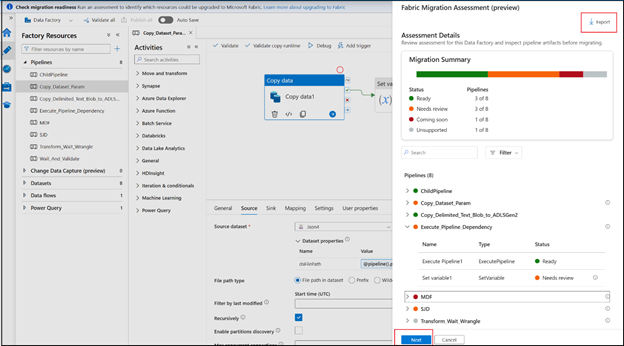
Figure: Review pipeline and activity readiness results in Azure Data Factory
(ADF only) Mount your factory to Fabric
For Azure Data Factory migrations, you’ll mount your ADF into a Fabric workspace and then continue the remaining steps inside Fabric.
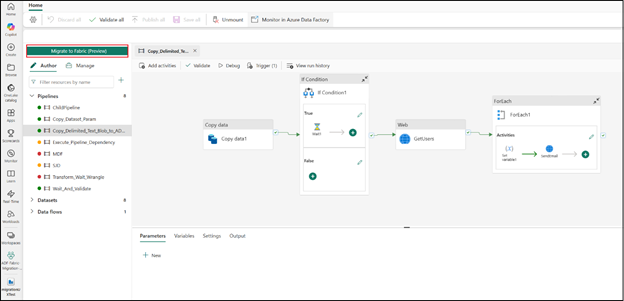
Figure: Continue the migration flow in Fabric after mounting
Migrate selected pipelines in Fabric
In Fabric Data Factory, open the mounted factory (ADF) or chosen workspace (Synapse), then migrate the pipelines you want to migrate.
Map linked services to Fabric connections and complete migration
During migration, you’ll map ADF/Synapse linked services to Fabric connections.
For guidance on creating and managing connections in Fabric, refer to Data source management.
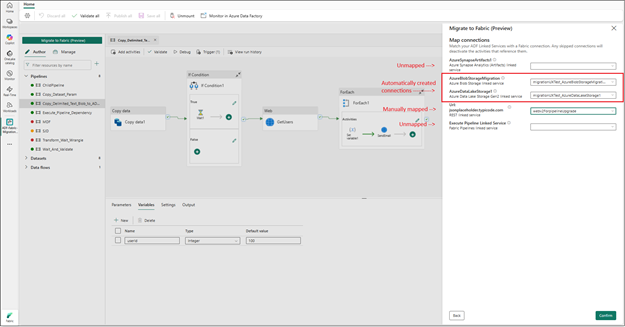
Figure: Map Linked Services to Fabric Connections
Validate and promote
After migration, validate connections and credentials, run end-to-end tests, and then re-enable triggers as needed. Pipelines migrate safely, with triggers disabled by default so you stay in control of execution.
Learn more: Upgrade your Azure Data Factory pipelines to Fabric.
Data Factory—Mirroring
Mirroring for SAP (Generally Available)
Built on top of SAP Datasphere’s Premium Outbound Integration, mirroring for SAP seamlessly integrates Fabric’s advanced mirroring engine with SAP Datasphere’s replication flows, unlocking connectivity through SAP’s native data extraction technologies.
This means direct access to the full suite of SAP applications—whether it’s SAP S/4HANA (on-premises or cloud), SAP ECC, SAP BW, SAP BW/4HANA, or cloud solutions like SAP SuccessFactors, SAP Ariba, and SAP Concur. Mirroring capabilities allow you to:
- Eliminate data silos by bringing SAP data alongside other enterprise sources in OneLake.
- Maintain end-to-end data lineage and governance for compliance and auditability.
- Accelerate time-to-insight with near real-time data replication no custom ETL required.
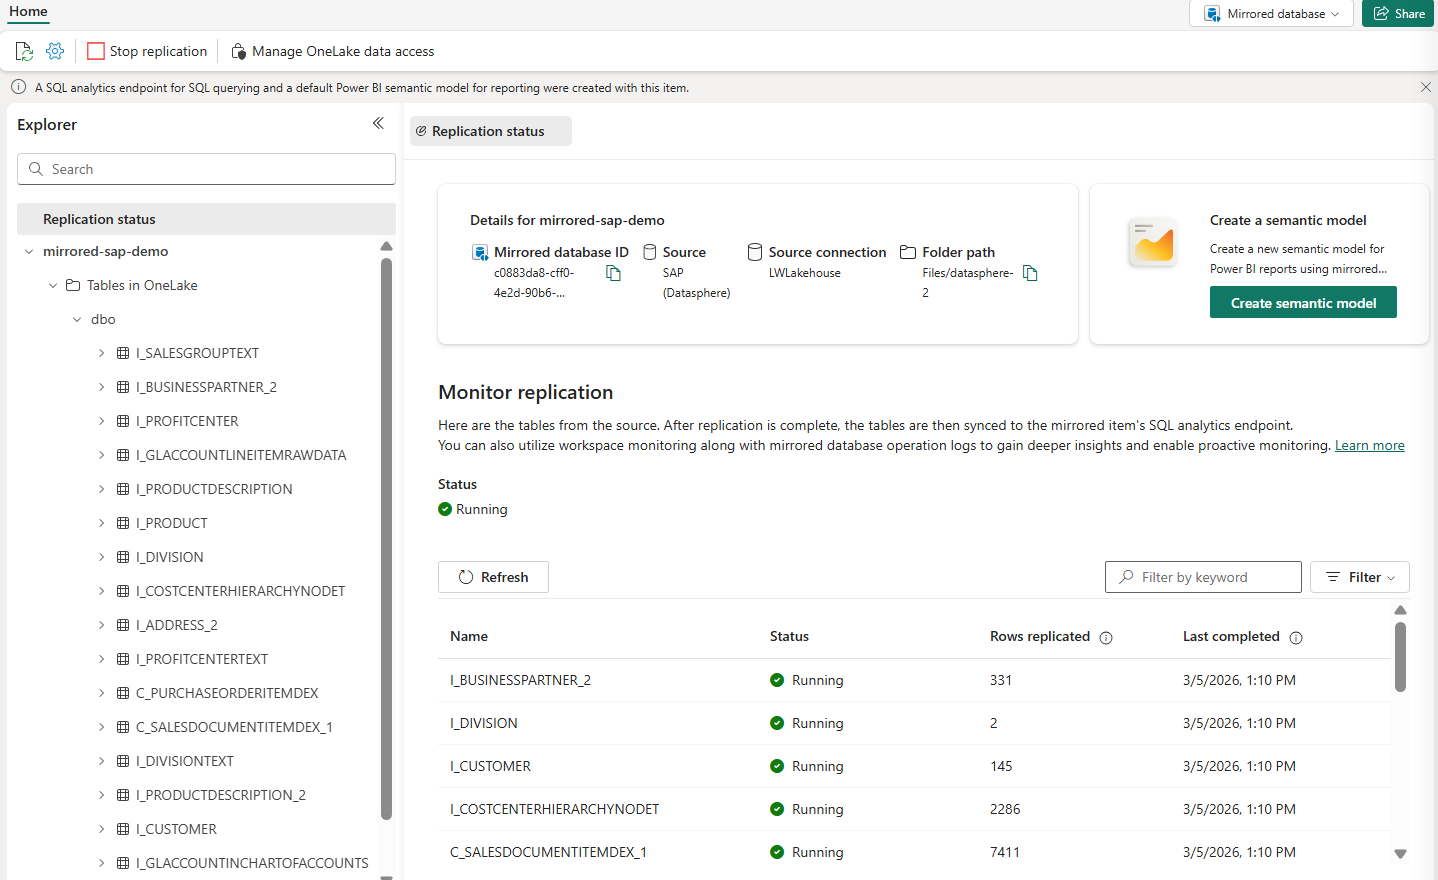
Figure: Mirrored database for SAP
Learn more in Microsoft Fabric Mirrored Databases From SAP.
Mirroring for Oracle databases (Generally Available)
Mirroring for Oracle is now available in Microsoft Fabric, bringing a production‑ready, enterprise‑grade way to continuously replicate Oracle data into OneLake with no custom ETL pipelines. This milestone reflects strong validation from customers already running Mirroring for Oracle in production and marks a major step forward in Fabric’s zero‑ETL data integration strategy. With near real‑time data replication, customers can keep analytics, BI, and AI workloads continuously in sync with their operational Oracle systems.
This release delivers improved stability, scale, and operational readiness, informed directly by customer feedback from public preview deployments. Mirroring for Oracle integrates natively with Fabric experiences like Power BI, Notebooks, and Lakehouses, enabling faster insights without disrupting existing Oracle workloads. As a fully supported capability, Mirroring for Oracle is now ready for broad enterprise adoption with long‑term investment from the Fabric platform team.
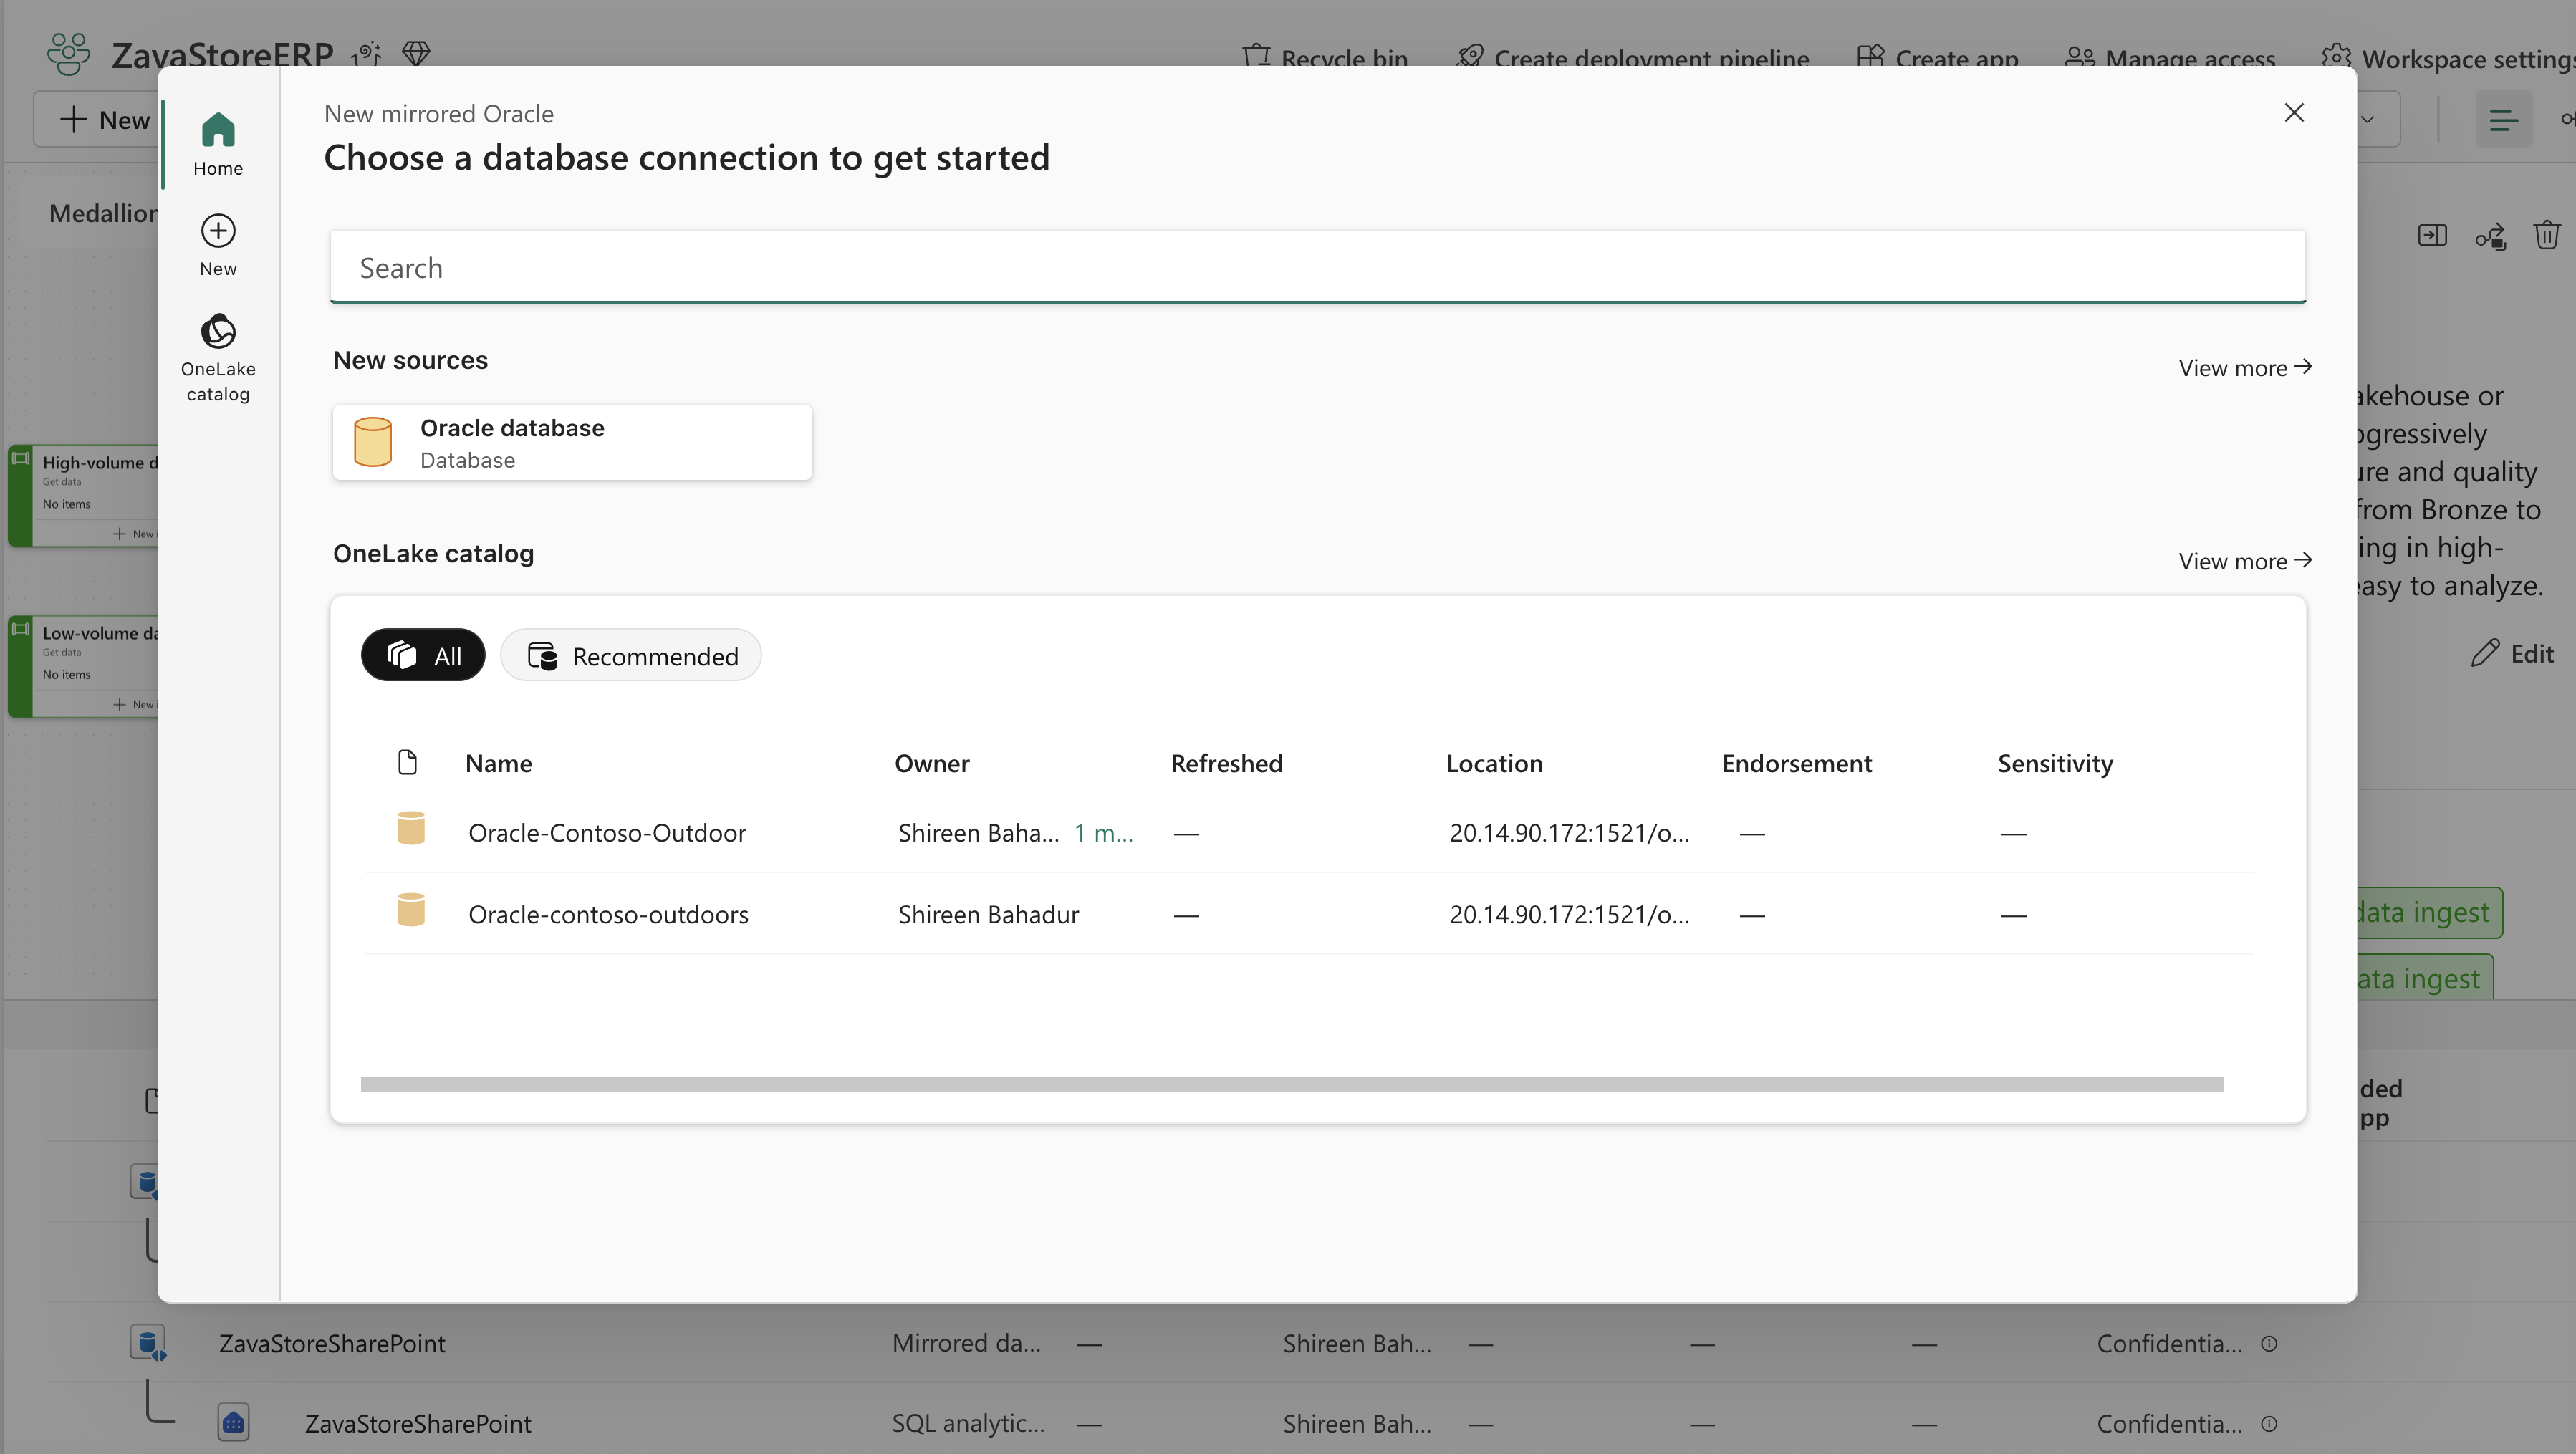
Figure: Mirroring for Oracle creation steps
Learn more at Mirroring for Oracle in Microsoft Fabric.
Mirroring for Azure Database for MySQL (Preview)
Mirrored databases now support Azure Database for MySQL. This capability enables you to directly replicate data from Azure Database for MySQL Flexible Server into Fabric in near real time, ensuring that information remains current, readily query-able, and seamlessly integrated throughout the analytics stack without the need for traditional ETL processes. Mirrored MySQL data is managed alongside other data sources, facilitating cross-source querying, unified reporting, and comprehensive analytics.
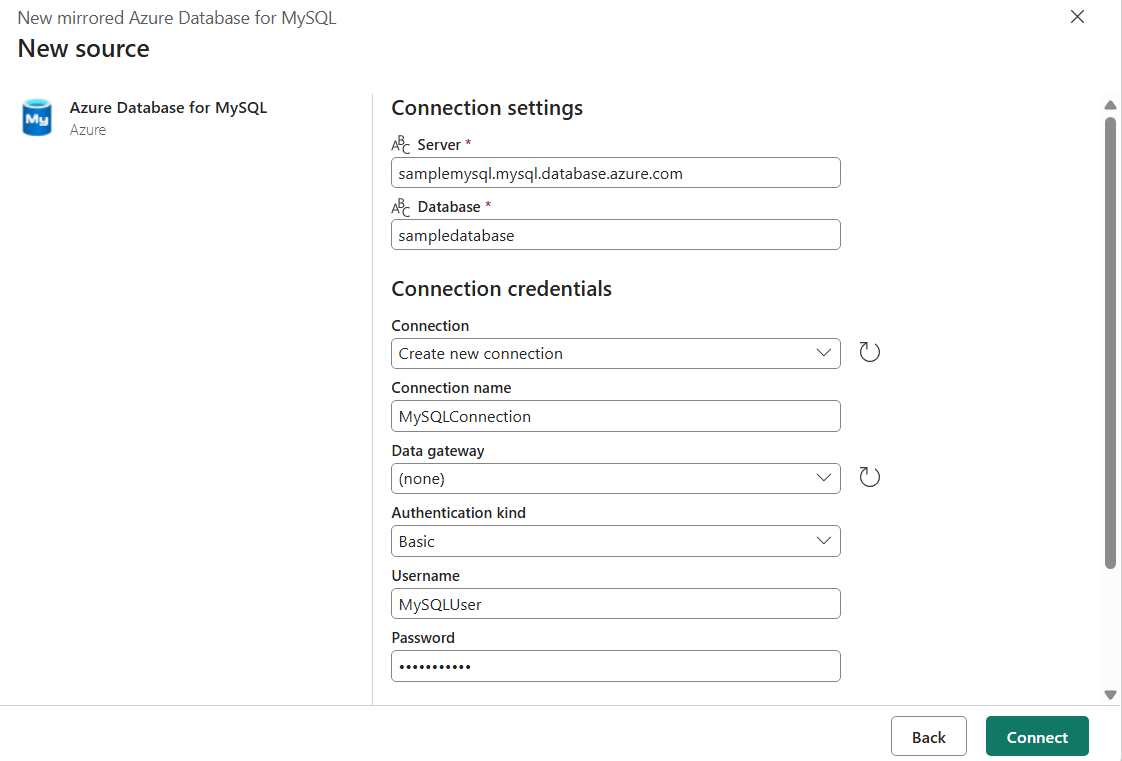
Figure: Screenshot of configuring a mirrored database for Azure Database for MySQL
Learn more in Microsoft Fabric Mirrored Databases for MySQL.
Mirroring for SharePoint List (Preview)
Mirroring for SharePoint Lists enables continuous replication of SharePoint Lists and Document Libraries into OneLake without building custom ETL pipelines. This capability keeps SharePoint data automatically synchronized in near real time, ensuring analytics in Fabric stay aligned while SharePoint remains the system of record. When mirrored, both list tables and document library metadata land in OneLake in an analytics‑ready format, with document libraries replicated via shortcuts and converted into Delta Lake tables.
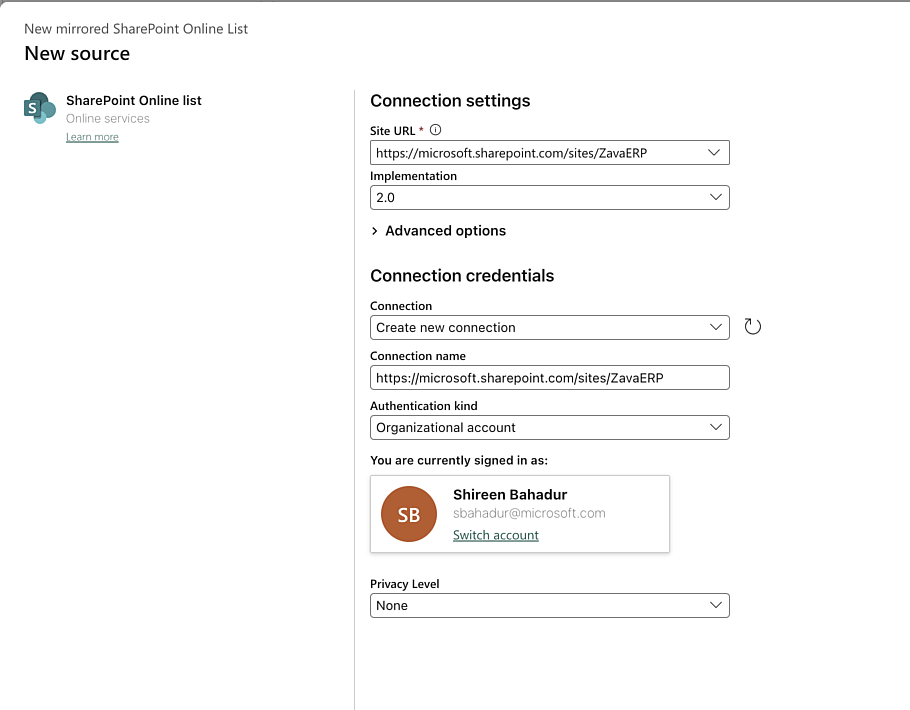
Figure: Mirroring setup for a SharePoint list
Fabric automatically creates a mirrored database and a read‑only SQL analytics endpoint, providing a rich analytical surface over the replicated data. As changes are made in SharePoint—such as new columns or updated rows—those updates flow continuously into Fabric, keeping schemas and data in sync. This public preview unlocks a simple, unified way to analyze SharePoint operational data across Fabric workloads including SQL, Power BI, notebooks, and data engineering experiences.
Extended Capabilities in Mirroring: Change Delta Feed and Snowflake Mirroring Support for Views (Preview)
Optional enhancements that build on core mirroring to support more advanced, real‑world analytics scenarios. These capabilities are designed for customers who need more than basic replication—enabling faster freshness, incremental processing, and business‑ready data without building or maintaining complex ETL pipelines.
Including Change Data Feed (CDF), which captures inserts, updates, and deletes at a granular level and applies them incrementally into OneLake, allowing mirrored data to stay continuously fresh without full reloads. Extended Capabilities also include Mirroring Views for Snowflake (with support for other sources coming soon), which replicate logical views from the source system into OneLake so that source‑defined business logic—such as joins, filters, and transformations—can be preserved directly in Fabric. Together, CDF and Views enable incremental pipelines, near real‑time analytics, and shaped datasets that are immediately ready for consumption across Fabric workloads.
Extended Capabilities are enabled during mirror setup and operate on top of core mirroring, allowing customers to selectively opt into advanced functionality as their analytics and AI needs grow.
Billing will be available as part of these extended capabilities starting April 1, 2026. More details about these capabilities and billing can be found on our documentation: Extended Capabilities in Mirroring – Overview.
Mirrored database now supports up to 1000 tables
To meet growing business demands and improve scalability, mirrored databases now support up to 1000 tables, raised from the previous limit of 500. This enhancement significantly expands the scale of datasets that can be mirrored from the source database, enabling customers to bring more comprehensive data into Fabric without fragmentation, drive deeper analysis and scale the data solution to meet evolving requirements.
Learn more in Mirroring in Microsoft Fabric.
That’s a wrap!
Publishing this update on the first day of FabCon feels especially meaningful. The features in this release reflect not just ongoing platform investment, but the ideas, feedback, and candid conversations we continue to have with the Fabric community—in sessions, online, and across preview programs.
Thank you for showing up, sharing your experiences, and helping shape where Fabric goes next. We encourage you to explore these updates, ask questions, and tell us what’s working—whether that happens here at FabCon, in community forums, or through ongoing feedback channels.
We’re grateful to be building Fabric alongside such an engaged community, and we’re excited to keep learning from you throughout FabCon and beyond.
Related blog posts
Fabric March 2026 Feature Summary
Agentic Fabric: How MCP is turning your data platform into an AI-native operating system
Something fundamental is changing in how developers interact with data platforms. Not a feature update, not a UI refresh, but a shift in the interface itself.
Evolving Agentic Applications on Microsoft Fabric: From Automated Deployment to Integrating Data Agents
In our previous post, Operationalizing Agentic Applications with Microsoft Fabric, we focused on a core challenge teams encounter once an agentic application moves beyond a proof of concept: operational reality. Specifically, how do you observe, govern, evaluate, and analyze what agents are doing once they interact with real users, data, and business processes at scale? … Continue reading “Evolving Agentic Applications on Microsoft Fabric: From Automated Deployment to Integrating Data Agents”
Microsoft Fabric
Accelerate your data potential with a unified analytics solution that connects it all. Microsoft Fabric enables you to manage your data in one place with a suite of analytics experiences that seamlessly work together, all hosted on a lake-centric SaaS solution for simplicity and to maintain a single source of truth.
Get the latest news from Microsoft Fabric Blog
This will prompt you to login with your Microsoft account to subscribe
Visit our product blogs
View articles by category
- Activator
- AI
- Announcements
- Apache Iceberg
- Apache Spark
- Community
- Community Challenge
- Data Engineering
- Data Factory
- Data Lake
- Data loss prevention
- Data Science
- Data Warehouse
- Databases
- Developer
- Fabric IQ
- Fabric ML
- Fabric platform
- Fabric Public APIs
- Fabric Workload
- Information protection
- Lakehouse
- Machine Learning
- Microsoft Fabric
- Monthly Update
- OneLake
- Power BI
- Power BI reports
- Real-Time Intelligence
- Roadmap
- Security and Compliance
- semantic model
- Uncategorized
View articles by date
- April 2026
- March 2026
- February 2026
- January 2026
- December 2025
- November 2025
- October 2025
- September 2025
- August 2025
- July 2025
- June 2025
- May 2025
- April 2025
- March 2025
- February 2025
- January 2025
- December 2024
- November 2024
- October 2024
- September 2024
- August 2024
- July 2024
- June 2024
- May 2024
- April 2024
- March 2024
- February 2024
- January 2024
- December 2023
- November 2023
- October 2023
- September 2023
- August 2023
- July 2023
- June 2023
- May 2023
- April 2023
- March 2023
- February 2023
- January 2023
- December 2022
- November 2022
- October 2022
- September 2022
- August 2022
- July 2022
- June 2022
- May 2022
- April 2022
What's new
- Microsoft 365
- Games
- Surface Pro 9
- Surface Laptop 5
- Surface Laptop Studio
- Surface Laptop Go 2
- Windows 11 apps
Microsoft Store
Education
- Microsoft in education
- Devices for education
- Microsoft Teams for Education
- Microsoft 365 Education
- Office Education
- Educator training and development
- Deals for students and parents
- Azure for students
Business
- Microsoft Cloud
- Microsoft Security
- Azure
- Dynamics 365
- Microsoft 365
- Microsoft Advertising
- Microsoft Industry
- Microsoft Teams
Developer & IT
- Developer Centre
- Documentation
- Microsoft Learn
- Microsoft Tech Community
- Azure Marketplace
- AppSource
- Microsoft Power Platform
- Visual Studio
Company
- © 2026 Microsoft
- Events and Announcements